# Research Team
DART (Detect, Analyze, and Respond to Cyber Threats) Laboratory, University of Virginia
Mati Ur Rehman: PhD student, mainly researching host intrusion detection systems and log traceability maps
Wajih Ul Hassan:23‘sp Sok,20’NDSS PROVDETECTOR,20’sp RapSheet,19’NDSS NoDoZe
# Summary
Recently, source-based intrusion detection systems (IDS) have gained popularity for their potential in detecting sophisticated advanced persistent threats (APT) attacks. These IDSs use source maps created from system logs to identify potentially malicious activity. Despite their potential, they face challenges in accuracy, practicality, and scalability, especially when dealing with large source graphs. We introduce FLASH, a scalable IDS that leverages graph representation learning through graph neural networks (GNN) on data source graphs to overcome these limitations. FLASH employs a Word2Vec-based semantic encoder to capture basic semantic properties such as process names and file paths as well as the temporal order of events in the source graph. Furthermore, FLASH incorporates a novel adaptation of a GNN-based context encoder that can efficiently encode local and global graph structures into expressive node embeddings. To learn benign node behavior, we utilize a lightweight classifier that combines GNN and Word2Vec embeddings. Recognizing the computational demands and slow processing time of GNNs, especially for large source graphs, we developed an embedding recycling database to store node embeddings generated during the training phase. At runtime, our lightweight classifier leverages stored embeddings without the need to regenerate GNN embeddings, thus facilitating real-time APT detection. Extensive evaluations of FLASH on real-world datasets demonstrate higher detection accuracy compared to existing source-based IDS. The results also illustrate FLASH’s scalability, robustness against impersonation attacks, and potential to accelerate the alert verification process.
# Research purpose
# Question raised
The main limitations of IDS based on traceability graphs:
- Ignore semantic information: Existing IDSs often ignore valuable semantic data such as process names, command line arguments, file paths, and IP addresses in source maps. This neglect may result in reduced detection accuracy.
- Ignore time and causality: Some IDS ignore the importance of time and causality of system events. This oversight can lead to false threat identification because it misses the sequence in which malicious activity occurs.
- Scalability Challenge: Real-time detection is critical for an effective IDS. However, some existing IDS face scalability issues, especially when dealing with large source graphs. This limits their real-time applications, causes log congestion, and leaves the system vulnerable to persistent attacks.
(1) Anomaly-based threat detection methods such as Kairos, MAGIC, Unicorn and other anomaly-based threat detection methods require regular retraining, resulting in high resource overhead and detection accuracy declining over time. This article does not refer to scalability.
(2) The continuous expansion of log data requires expansion on the basis of the original traceability graph, that is, it needs to support the real-time addition of new edges and nodes to the traceability graph.
- Coarse-grained Detection: Many IDS identify malicious subgraphs rather than individual malicious nodes, making alert validation and attack reconstruction by security analysts time-consuming and error-prone. Additionally, this approach makes these systems vulnerable to evasion attacks.
Sometimes, you aren’t what you do: Mimicry attacks against provenance graph host intrusion detection systems(2023 SP), evaluation experiments on StreamSpot, Unicorn, ProvDetector, Pagoda and SIGL (FGA) show that existing anomaly-based detection systems can be circumvented through effective means. This attack strategy confuses the detection system by injecting benign substructures into the attack graph.
In this work, we propose FLASH, a novel IDS that leverages source graph representation learning to efficiently and accurately detect APT attacks. In order to solve the problem of ignoring semantic information during the detection process, FLASH uses Word2Vec-based embedding technology to encode various node attributes (such as process names, command line parameters, file paths, and IP addresses) present in the source graph into semantically rich feature vectors. Furthermore, we modified the Word2Vec technique to obtain time-sensitive embeddings, solving the problem of ignoring the temporal order between events. Experiments show that semantically rich feature vectors that consider the temporal order between events can more effectively distinguish benign nodes from malicious nodes, thereby reducing false positive rates and improving overall detection performance.
To encode structural and causal information, we apply graph representation learning using graph neural networks. Graph representation learning via graph neural networks (GNN) makes it possible to learn expressive node embeddings that capture local and global graph structures. However, existing GNN techniques are not scalable and very slow, especially for large graphs, which makes their application in the field of source-based IDS extremely challenging and impractical.
The scalability challenge of GNNs providing real-time detection is addressed by implementing two innovative techniques. First, we improve the efficiency of graph traversal in graph representation learning by selecting only edges relevant to threat identification. Second, we design a GNN embedding database inspired by embedding recycling techniques previously applied to language models [59]. This database stores node embeddings during training and runtime, and we use these pre-generated GNN embeddings for real-time detection, reducing real-time processing time by more than 70% compared to state-of-the-art GNN-based IDS while maintaining superior detection performance.
To address the challenge of coarse-grained detection, FLASH performs fine-grained anomaly detection by using GNNs to identify individual malicious nodes (such as processes and files) rather than the entire anomaly subgraph (which also contains benign nodes). Furthermore, our approach demonstrates robustness against adversarial imitation attacks against origin-based IDS, as proposed by Goyal et al. After detection, FLASH aids in threat management and attack reconstruction by using FLASH-generated anomaly scores to rank threat alerts and create Attack Evolution Graphs (AEGs). These AEGs contain only alert nodes and their causal links, providing a concise view of the intrusion’s progression compared to the original source graph.
# Current status of research
Existing provenance-based intrusion detection systems (IDS) primarily function by learning benign behaviors in provenance graphs, detecting anomalies whenever there is a deviation from these established models.
ProGrapher leverages Graph2Vec and TextRCNN embeddings to identify graph-level anomalies.
StreamSpot extracts graph features to build benign models and leverages clustering techniques to identify anomalous graphs.
Unicorn adopts a graph similarity matching method to locate abnormal graphs, which reduces source graph features into histograms and forms fixed-size graph sketches, which are then clustered to detect anomalies.
ProvDetector adopts a path-based malware detection strategy. It identifies uncommon paths in the graph, uses path embedding generation, and employs a local outlier factor approach for anomaly detection.
ThraTrace uses GNN to perform node-level anomaly detection, learn the structural information of nodes in benign data sets, and identify anomalies based on deviations in learned behavior.
ShadeWatcher uses GNN to describe system entities’ preferences for interacting entities, suggesting adversarial interactions through edge-level anomaly detection.

Semantic Encoding: Existing provenance-based IDS utilize ML algorithms to detect system attacks based on the system event distribution of each node as a feature vector. However, these systems often fail to take into account key semantic attribute factors. Such as process name, command line or file path.
Temporal Encoding: Existing source-based IDS do not consider the temporal order of system events, but only focus on the event frequency of each node. Given that multiple nodes can perform the same events in different orders, this approach limits the model’s understanding of benign node distributions. This oversight leads to an increased rate of false positives. Experimental results show that false positives are significantly reduced when incorporating time sorting compared to the baseline that ignores the time factor.
Scalability: Some existing provenance-based IDS use GNNs to extract structural information from the provenance graph, which improves detection by capturing relationships between adjacent nodes. However, the high computational requirements of GNNs may hinder the scalability of the system and complicate real-time intrusion detection. FLASH, on the other hand, implements scalability-enhancing techniques for GNNs that significantly improve performance compared to existing systems that do not use these techniques.
Improving scalability here refers to improving detection efficiency? Previously, it was because the GNN calculation consumes too much and is inconvenient to expand.
Detection Granularity: The granularity of graph-based detection plays an important role in the effectiveness of IDS. Many existing IDSs such as StreamSpot and Unicorn use graph-level anomaly detection, making it difficult to identify stealthy attacks with minimal activity.
Contextual Alerting: IDS with graph-level granularity identifies potentially malicious subgraphs rather than pinpointing the exact malicious nodes (such as processes and files) responsible for threat alerts. Because security analysts must determine the accuracy of each IDS-generated threat alert by understanding the context surrounding the alert, this results in attack reconstruction and alert validation processes that are time-consuming and error-prone. In this case, security analysts must thoroughly analyze the labeled subgraph to find potentially malicious nodes. Node-level and edge-level detection methods, on the other hand, increase the efficiency of post-attack investigations by pointing directly to the exact entity involved in the intrusion and the sources of data surrounding that entity.
Robustness against Imitation Attacks: Goyal et al. (23’SP) introduced a method to circumvent IDS operating at graph and path level granularity. Their method manipulates the distribution graph encoding, modifying the node neighborhoods in the attack graph to mimic the node neighborhoods in the benign origin graph. When we apply the adversarial attack strategy defined by Goyal et al. in our proposed system, we find that our system is resistant to such evasion attempts. This resistance confirms that node-level detection methods, such as those used by FLASH, provide better protection against evasion attacks because they are able to identify anomalies at a more granular level.
# Contributions to this article
Method Strengths: FLASH outperforms existing source-based IDS in detection rate. By using our GNN embedded database, we successfully reduce the time overhead of anomaly detection significantly, improving performance by up to three times compared to existing state-of-the-art provenance-based IDS. Additionally, by using FLASH-generated threat alert anomaly scores, security analysts can effectively classify alerts and reduce workload by up to 60%, demonstrating the potential of FLASH in managing threat alert fatigue
There is doubt that the workload has been reduced by as much as 60%. What are the evaluation criteria? Haven’t seen it there yet
The main contributions of the work are:
- An IDS based on provenance graphs is proposed: FLASH, which utilizes contextual and structural information in the provenance graph to enhance its detection capabilities.
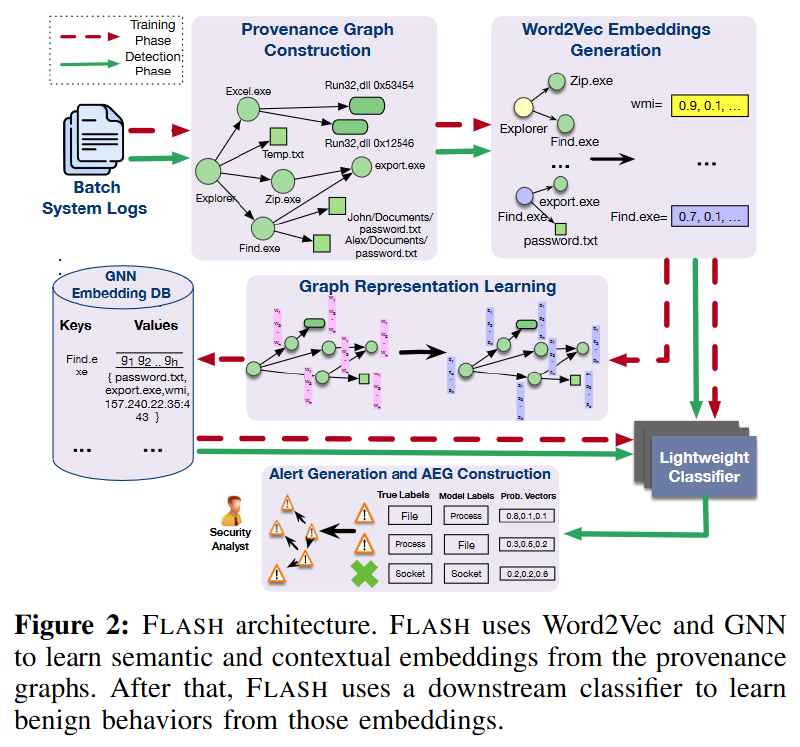
- Introduced a two-step process to generate semantic and contextual embeddings using Word2Vec and GNN respectively. This process is followed by real-time anomaly detection via lightweight classifier models, ensuring the scalability and efficiency of the system.
- Provide two schemes—selective graph traversal and embedded recycling database—to make graph representation learning practical for IDS settings.
- A comprehensive evaluation of the technique on real-world datasets. The results highlight FLASH’s effectiveness in identifying malicious activity, its ability to defend against adversarial imitation attacks, and its ability to accelerate the alert verification process.
Open source address: https://github.com/DART-Laboratory/Flash-IDS
# Research methods

FLASH consists of five key modules: source graph constructor, Word2Vec-based semantic encoder, GNN-based context encoder, embedding database, and anomaly detector.
FLASH generates provenance graphs from streaming system logs, uses semantic attributes to create feature vectors for nodes, and applies GNN for context-aware encoding. These embeddings are stored in a database and later used by lightweight classifiers during threat detection.
# Traceability graph construction
System logs are first converted into provenance graphs, and the graph construction process is rooted in existing provenance graph research. It involves three main steps. First, FLASH interprets system logs, such as Windows event logs or Linux audit logs. These logs consist of records of host events such as process executions, file operations, and network connections. Next, FLASH manages real-time log collection by processing system logs in configurable batches. Batch size K sets the number of system events per batch. FLASH then performs sequential operations on each log batch and converts them into source graphs for subsequent analysis.
Finally, FLASH uses the parsed data to construct the origin graph, which includes two node types: process nodes and object nodes. Object nodes contain files, network streams, modules, and other system objects. The edges between these nodes are labeled with a specified event type (system call), which demonstrates the causal relationship between connecting nodes and event timestamps. Additionally, nodes contain properties such as process name, command line, file path, IP address, port number, and module path, providing further context and detail.
# Semantic attribute encoding
Reference article: Word Embedding (word2vec) - “Hands-on Deep Learning” Document (gluon.ai)
System logs contain rich properties related to various system entities. These properties (such as process names and file paths) first need to be encoded into vector space so that the model can use them. Some traditional ways of doing this are one-hot encoding [11] and bag-of-words [2] methods. However, these methods result in very sparse vectors without taking into account the context surrounding each word in the document. To overcome these limitations, we apply the Word2Vec model to convert these attributes into a dense vector space.
Word2Vec is a neural network-based method that excels at learning word vector representations. It works by predicting the context of words through a shallow neural network. This method generates a low-dimensional dense vector for each word, where similar words carry similar vector representations. Our model considers the following node properties for each node type: process name and command line arguments for process nodes, file paths for file nodes, network IP addresses and ports for socket nodes, and module names for module nodes. These data help generate semantically rich feature vectors.
How does word2vec achieve attribute conversion?
The function of word2vec is to encode node attributes, and the principle of word2vec is to encode words by learning word information from context. What is the context information of attributes?
Process nodes predict process names and command line parameters; file nodes predict file paths; socket byte nodes predict network IP addresses and ports; module nodes predict module names.
For example, I’m hot because it’s summer, to embed the hot code, you need to combine it with the I’m _ because it’s summer sentence. The main principle is to predict the context based on hot and use the neural network parameters as the embedding vector.
This method captures the semantic relationships between words and generates dense embeddings that provide node features for subsequent graph representation learning. This comprehensive feature set complicates the imitation of benign nodes by malicious nodes. For successful impersonation, malicious nodes must replicate system activity, chronology, and semantic properties. This improved detection capability enables our model to uncover otherwise overlooked malicious activity. Algorithm 1 outlines the process of generating semantic embedding vectors.

Timing Coding
The standalone Word2Vec model has a Key limitation: it does not preserve the order of words in a sentence. To correct this problem and enhance the expressive power of the model, we designed a temporal encoding scheme that assigns individual weights to each word embedding, and these weights are accumulated across sentences, producing embeddings rich in temporal information. This approach is initiated by chronologically arranging system events based on timestamps, thus facilitating the integration of chronological order into sentences. Positional encoding (a concept borrowed from Transformers) is then incorporated into the input embedding to convey information about the position of each token in the sequence. This inclusion is crucial because Word2Vec lacks a built-in concept of order, so positional encoding allows the model to differentiate tokens based on their sequence position. The position encoding vector of the marker at position i is given by:
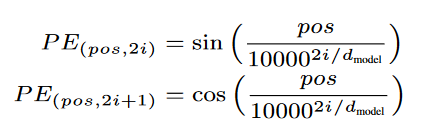
where d represents the dimension of the embedding and j is the index of the dimension within the embedding.
The position encoding vector is then added to the Word2Vec embedding vector for each token at that position. This operation is performed element-wise, resulting in the marker at position i being embedded as:
$Emb_i=Emb_i+PE_i$
By combining Word2Vec embeddings with positional encoding, our model captures not only the semantic associations between words, but also the order of words in the summary sentence. This rich representation allows the GNN in the next step to better understand the context and detect malicious activity that may have gone undetected before.
# Traceability graph representation learning
Effective identification of covert attack nodes in a provenance graph requires encoding the k-hop neighborhood structure around each node. The current state-of-the-art method to achieve this feat is graph representation learning through graph neural networks (GNN). GNN is good at learning low-dimensional vector representations of nodes in graphs, thereby effectively capturing their structural information using the connections between nodes.
In our method, we utilize the Word2Vec embedding obtained in the previous step as the feature vector of the nodes in the GNN. GNN uses these features in conjunction with the graph structure to learn the structural information of each node in the origin graph. However, due to the message passing process, adopting graph representation learning may bring huge resource overhead and introduce higher latency, especially in large graphs. Message passing requires nodes to exchange information with neighbors in the graph, a process that is iteratively repeated to enable nodes to receive information from increasingly distant parts of the graph. Therefore, continuous utilization of GNNs in real-time intrusion detection processes is not only resource-intensive but also leads to scalability issues since the provenance graphs in enterprise environments are very large. To address the above challenges and make GNN suitable for source-based IDS, this paper adopts two techniques as described below.
Run the GNN offline to generate contextual embeddings, which are then stored for later use by lightweight classifier models. We observe that the vast majority of system entities perform the same set of activities during each system execution, making it inefficient to run GNNs every time they are encountered. Our meticulous analysis of the DAPRA OpTC dataset shows that more than 80% of system entities exhibit the same neighborhood structure during both the benign and evaluation phases of system execution. By storing the GNN output of these nodes, we can avoid using the GNN approximately 80% of the time when running FLASH in real time.
# Selective graph traversal
Our GNN model is inspired by the GraphSage framework, which is recognized for its ability to learn node embeddings. GraphSage uses a neighborhood aggregation approach to capture local information about nodes. However, to ensure efficient processing of large provenance graphs relevant for threat detection, we adopted GraphSage’s graph traversal algorithm. This adaptation prioritizes edges that are important for threat detection and investigation, eliminating the need for a complete source graph traversal. To achieve this goal, we devise a series of graph traversal principles. These principles guide GraphSage to selectively aggregate information from specific edges before applying GNN. Utilize the following Traversal Principle (TP) to determine which nodes and edges should be included during aggregation.
- TP1: Unique Edge Sampling:
- This principle involves sampling each type of edge between two nodes only once in the traversal. If there are multiple edges of the same type connecting the same pair of nodes in the graph, only one of the edges is selected for processing.
- TP2: Low-Priority Event Exclusion:
- This principle involves excluding edges that represent low priority and forensically insignificant system events. For example, you might exclude deletion events that represent temporary files, or loops that represent process node exit events.
- TP3: Execution-Specific Information Filtering:
- This principle consists in aggregating nodes and edges with the same execution-specific information only once. In a graph, many adjacent nodes may differ only by execution-specific properties, such as process nodes with the same image path but different process IDs.
- TP4: User-Specific Attribute Handling:
- In this principle, nodes or edges are considered identical if they differ only in user-specific attributes. For example, two module nodes with the same module path but different user IDs will have user-specific attributes ignored when processing.
These basic principles enable the system to generate information-rich and structurally rich node vector representations while reducing computational overhead.
For each node v ∈ V , let $X_v$ be the input feature vector of the node, and let $h^{(0)}_v = X_v$ be the initial embedding. At each iteration k of the algorithm, GraphSage updates the embedding of each node v ∈ V using the following equation:

where σ(·) is a nonlinear activation function such as ReLU, $\Nu(v)$ is the set of neighbors of node v in the graph, and AGGREGATEk(·) is the neighborhood of node v and its embedded aggregate function iteration k when combined. The matrix $W^{(k)}$ is a learnable parameter matrix that maps the aggregated features to a new embedding space. Following this process, GraphSage can encode the structural information around each node into vector space.
# Training and weighted cross-entropy loss
We adopt a semi-supervised node classification method to train our novel GNN model. Our model uses the input features and graph structure of a node to classify its type. Our source graph includes multiple node types such as processes, files, and sockets. A GNN model trained using labeled data can learn to identify types of benign nodes. Since node types in system logs are usually unbalanced, we use weighted cross-entropy as the loss function. Weighted cross-entropy loss is a variation of the cross-entropy loss function that is used when classes are imbalanced in the data. Weighted cross-entropy loss solves this problem by assigning each category a weight that reflects its importance. Typically, the weight of each category is set to be inversely proportional to the frequency of samples in that category. This approach ensures that the loss function focuses more on minority classes, thereby enhancing the model’s ability to correctly classify these classes. The equation for weighted cross-entropy loss is:
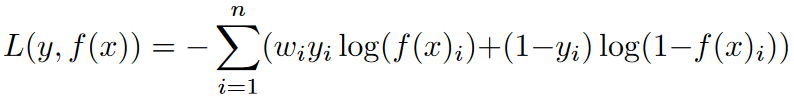
where y is the true label vector, f (x) is the predicted label vector, n is the number of classes, $w_i$ is the weight of the i-th class, and log is the natural logarithm. By training our GNN model using this loss function, we ensure that it can effectively learn the structural relationships between different node types in the origin graph. Once the model is trained, the embeddings it generates can be used as input to lightweight classifiers for real-time intrusion detection. Therefore, our FLASH system can leverage the power of GNNs and lightweight classifiers to effectively identify stealth attack nodes without the need to continuously execute GNNs during real-time intrusion detection.
# Embed recycling database
Our system employs a trained GNN model to generate structural embeddings for all nodes present in the benign dataset. To efficiently retrieve and store these GNN output vectors during real-time threat detection, we built a specialized key-value store. The key is designed as a Persistent Node Identifier (PNI), associated with node attributes that remain unchanged across different system executions. These include process names, file paths, module paths, and network stream IP addresses. The corresponding value encapsulates the GNN-derived embedding, as well as the set of neighbors associated with that particular node.
We leverage attribute abstraction techniques to remove user- and execution-specific information. This ensures that the stored embeddings are universal. Specifically, there are the following abstract modes:
- User abstract mode: Implemented for process and file node types, this mode omits user ID from the process name and file path, achieving a high degree of generalization. For example, the file path /Users/john/.bashrc is abstracted to /Users/*/.bashrc.
- Network connection abstraction architecture: Applied to the socket point type, this architecture eliminates start and end times, thereby enhancing the versatility of different system executions. For example, a socket node with attributes IP:192.168.1.10, Port:22, Start:12:00:00, End:12:10:00 is abstracted into IP:192.168.1.10, Port:22, and only the necessary connection information is encapsulated.
- Module path abstract architecture: module nodes have path and base address attributes. When the base address changes, the path remains the same across executions. This architecture preserves only module paths, ensuring consistent and generalizable representation of module nodes.
Leverage precomputed embeddings
The motivation behind building our embedded key-value database is twofold: to optimize real-time anomaly detection and reduce computational overhead. By pre-computing and storing GNN embeddings of nodes with stable neighborhood structures, our method quickly assigns the stored embeddings to nodes with matching neighborhood structures during the real-time detection stage, thereby enhancing the performance and scalability of the detection pipeline.
In this setting, the neighborhood set plays a key role. It helps determine whether the neighborhood structure of a node during real-time analysis matches that observed during the benign phase. If there is a match, the node is immediately assigned the embedding stored in the key-value store. On the other hand, if there are differences in neighborhood structure, the model will default to using Word2Vec features generated in real time for anomaly detection. This balancing strategy ensures the computational efficiency and adaptability of our system to changes in network structure.
We use the Jaccard index to compare a node’s stored neighborhood with its current neighborhood and then assign it to a pre-stored GNN embedding.
During FLASH’s real-time detection phase, a node must meet the following two conditions to be assigned its stored GNN embedding:
- The node’s Persistent Node Identifier (PNI) must exist as a key in the feature store. PNI is built based on node attributes such as process name, file path, module path, and network stream IP address, which remain unchanged across different system executions.
- The stored neighborhood set corresponding to this PNI in the feature store must have a Jaccard index of 1 with the current neighborhood set for the given node. When the Jaccard similarity is 1, it means that the two neighbor sets are exactly the same.
If a node meets the above criteria, it is assigned a stored GNN embedding; otherwise, FLASH relies on the Word2Vec function to classify the node using our lightweight classifier.
|
|
Splice node_feature and feature_vector into a new array in the column direction (horizontally).
# Lightweight classifier
In our search for the best lightweight classifier, we evaluated a number of candidate classifiers, including XGBoost, Support Vector Machines (SVM), and Random Forests. This article chooses XGBoost to perform anomaly detection tasks. XGBoost uses a collection of decision trees and advanced boosting techniques to improve accuracy.
XGBoost minimizes the regularized objective function 𝐽=𝐿(𝑦,𝑓(𝑓))+Ω(𝑓), using gradient boosting to iteratively add new trees to the set. Each new tree aims to minimize the gradient of the loss function relative to the current ensemble prediction. The XGBoost model uses concatenated Word2Vec encoding vectors and GNN embedding vectors for each node. It retrieves GNN embeddings from a pretrained key-value store, generates Word2Vec features in real time, performs inference, and saves the output for use in the next pipeline stage. This powerful process underpins the performance and scalability of our IDS.
FLASH detects abnormal nodes by comparing predicted node types with actual node types. The model considers neighborhood structure and node attributes to learn benign patterns associated with various node types. For example, it can outline the interactions between different processes and file types and their connections. Malicious entities often exhibit neighborhood structures and properties that deviate from benign patterns. Therefore, when the model encounters such outliers at runtime, they do not conform to the learned node distribution, resulting in misclassification.
Using Word2Vec features and stored GNN embeddings, FLASH can predict system entity (node) types. Misclassified nodes in the output indicate potential threats. We introduce a threshold parameter T to control alert generation. This parameter limits the classification probability of the predicted class and reflects the model’s confidence in its predictions. Higher scores mean greater confidence and possible anomalies.
# Construction of attack evolution graph
Given that the generated alerts may be scattered throughout a large source graph, understanding the causal relationships between nodes requires analysts to make numerous backward and forward trace calls to investigate the alerts. Furthermore, the different stages of APT attacks are scattered across the source graph, making it difficult to identify their relationships and progression. To address these challenges, we introduce a scheme to build compact attack evolution graphs (AEG) from large origin graphs and FLASH-generated alerts.
To address these challenges, we introduce a scheme to build compact attack evolution graphs (AEG) from large origin graphs and FLASH-generated alerts. The core concept is to interconnect causally related alerts in a source graph, thereby building a series of concise AEGs. These AEGs encapsulate only alert nodes and their causal links, providing a simplified and clear view of alert node interactions. This reduction significantly simplifies the original diagram, making it easier for analysts to quickly and efficiently grasp attack progress. These streamlined AEGs not only simplify the analysis of source graphs, but also provide analysts with a powerful tool to quickly correlate the different stages of an APT attack. This correlation provides a clear view of overall attack strategy and tactics, aiding incident response.
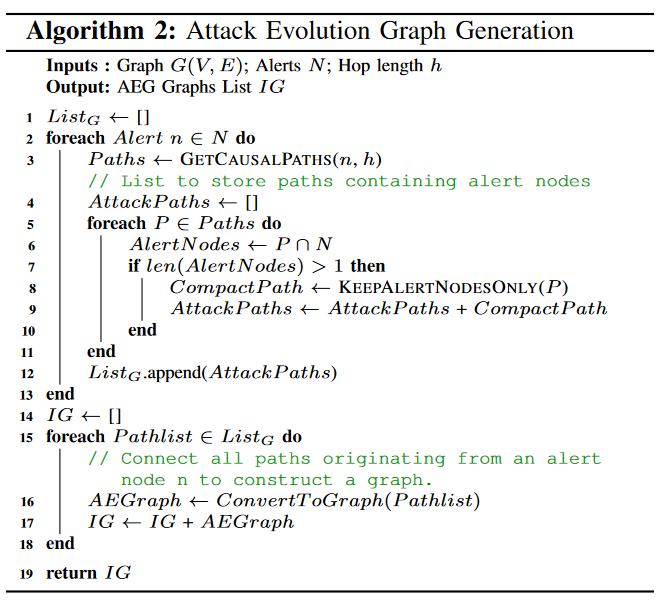
Algorithm 2 explains the process of creating AEG. The algorithm takes an origin graph G(V, E) and a set of alarms N with jump length h. Then it returns the AEG list.
- Initialize empty list IG:
- First, initialize an empty list IG to store all eventually generated AEG maps.
- Loop through each alert:
- Loop through
foreach Alert n ∈ N do, iterating over each alert n in the provided set N of alerts.
- Loop through
- Get the causal path:
- For each alert, call the
GETCAUSALPATHS(n, h)function to obtain the causal path associated with the alert node, where h represents the hop length.
- For each alert, call the
- Initialize attack path list:
- For each alert, initialize an empty list AttackPaths to store the attack paths containing the alert nodes.
- Traverse all paths:
- Traverse all paths obtained in the previous step through nested
foreach P ∈ Paths doloop.
- Traverse all paths obtained in the previous step through nested
- Filter paths that contain alert nodes:
- Inside the loop, use
AlertNodes ← P ∩ Nto calculate the intersection of path P and alert set N to obtain the path part containing alert nodes.
- Inside the loop, use
- Check the number of alarm nodes:
- If the filtered path contains more than one alert node (
len(AlertNodes) > 1), it is considered a valid attack path.
- If the filtered path contains more than one alert node (
- Construct a compact attack path:
- Use the
KEEPALERTNODESONLY(P)function to keep only alert nodes from path P to build a compact attack path CompactPath.
- Use the
- Add to attack path list:
- Add compact attack paths to AttackPaths list.
- Add attack path list to IG:
- Add the AttackPaths list containing all attack paths to the final AEG graph list IG.
- Convert to graph structure:
- For each path list in IG, use the
ConvertToGraph(Pathlist)function to convert the path into a graph structure AEGraph.
- For each path list in IG, use the
- Return to AEG chart list:
- Eventually, the algorithm returns the list IG containing all AEG graphs.
# Experimental evaluation
An event batch size of 250k was used in the experiment, and the Jaccard similarity threshold was 1.
- How does FLASH detection accuracy compare to existing systems?
- How does FLASH’s GNN optimization improve performance?
- How does the batch size parameter affect FLASH’s performance, accuracy, and resource usage?
- How robust is FLASH against imitation attacks?
- What are the results of ablation studies on various FLASH components and hyperparameters?
- How well does FLASH assist in the alarm verification process?
# Dataset
E3 Dataset 1 is from DAPRA’s third red and blue team exercise. It provides audit log data showing benign and offensive behavior. We use DAPRA’s ground truth documentation to label OpTC attack events. For E3, we use tags from ThraTrace. To identify attack graphs in the StreamSpot and Unicorn datasets, we refer to their respective documentation.
The DAPRA OpTC dataset provides a broad view of benign and malicious audit records from approximately 1000 hosts. The dataset has six days of benign activity for training, and the following three days detailing malicious activity for evaluation. Each of the three days showed a different type of attack. Day one mapped out transition scenarios for PowerShell Empire, including initial footing, lateral movement, and privilege escalation. The data breach was recorded the next day. Malware upgrades were recorded on the third day.
To evaluate FLASH, we use two source graph-based IDS as benchmarks: ThreaTrace and Unicorn. We use the same detection metrics as the corresponding systems we compare against. We use node-level anomaly detection for ThreaTrace comparison, while for Unicorn we perform graph-level anomaly detection because Unicorn cannot perform fine-grained abnormal node detection. FLASH identifies a graph as an anomaly if the number of anomalous nodes in it exceeds a certain threshold.
# Detection performance
Table 2 shows the performance of FLASH and ThraTrace [67] on our evaluation dataset. FLASH consistently outperforms ThraTrace, achieving superior accuracy and F-score values. Compared to ThraTrace, FLASH leverages word2vec and system properties to generate semantically rich vectors. This provides valuable context for the model to establish clear decision boundaries between normal and abnormal nodes, thereby reducing false positives and improving accuracy and F-score. Since the ThreaTrace paper lacks evaluation results on the OpTC dataset, we execute ThreaTrace on OpTC to obtain the evaluation results. The results show that FLASH significantly outperforms ThraTrace as OpTC attacks are more difficult to detect due to smaller and well-mixed malicious activities. ThraTrace only relies on system call distribution mode as a feature, which is not enough. On the other hand, the Word2Vec encoding feature adopted by FLASH provides more semantic information to each node, making it more difficult for attacking nodes to hide themselves.

Table 3 gives the experimental results of detection comparison between the two systems. While Unicorn’s performance is comparable to FLASH on some datasets (e.g., Cadets), which have less stealthy graphs, FLASH outperforms Unicorn on more stealthy attack datasets (e.g., Unicorn SC-1 and SC-2). This advantage is attributed to FLASH’s use of graph representation learning and time-sensitive node embedding, which enables it to generate a deep understanding of baseline benign behavior. Therefore, FLASH can effectively label even the most subtle attack graphs.
# Scalability analysis
This paper evaluates the scalability enhancements provided by leveraging GNN embedding databases in FLASH. These pre-stored embeddings are combined with Word2Vec semantic encoding to serve the XGBoost classifier. When examining the E3 dataset, we found that a large proportion of nodes lacked attribute data. For example, in four DARPA E3 datasets (Cadets, Trace, FiveDirections, and Theia), 70%, 54%, 72%, and 76% of nodes respectively have missing attribute data. This data is critical for node and neighbor identification and for assigning persistent node identifiers (PNIs). Without these PNIs, our efficient embedding database cannot be used. However, the OpTC dataset provides complete node information, enabling FLASH to implement a two-step pipeline. Therefore, during the inference (detection) phase, we exclusively use OpTC’s embedded database. In contrast, we generate GNN embeddings for E3 during inference.
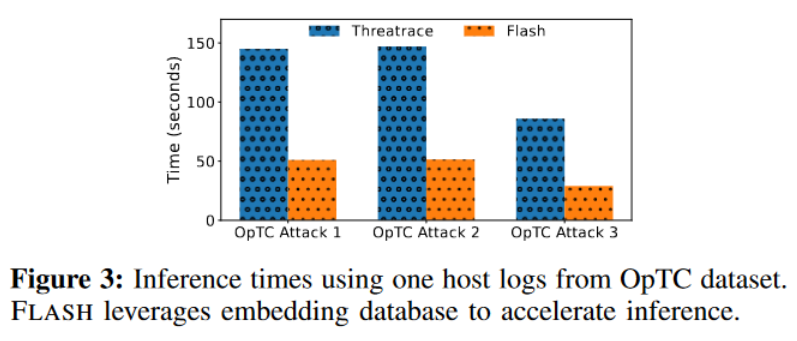
During the training phase, FLASH’s GNN model generates embedding vectors from benign data and stores them in a key-value data store for future use. At runtime, these stored embeddings are combined with Word2Vec vectors as feature vectors for the XGBoost model, which then performs anomaly detection. The detection results summarized in the “FLASH (GNN + XGBoost)” column of Table 2 show that the detection performance of FLASH leveraging this two-step pipeline is comparable to using only GNN for anomaly detection and significantly exceeds ThreaTrace. Additionally, this two-step pipeline significantly speeds up processing compared to ThraTrace. As shown in Figure 3, the reuse of GNN embeddings results in three times less time overhead than ThraTrace. The reported inference times use a day’s worth of system logs from a single host in the OpTC dataset. We observe similar reductions in inference time overhead when we use logs from more hosts in our experiments. As a result, our approach can save large enterprises hours of inference time and help prevent log congestion, ensuring timely alerts.
In our experiments, we observed that FLASH successfully distributed pre-stored embeddings to approximately 84% of the nodes at runtime, with a hit rate as high as 90%. This high allocation rate indicates that many system entities exhibit repetitive patterns of behavior, which multiple studies have also shown, allowing FLASH to leverage its two-step pipeline for enhanced scalability and real-time APT detection.
# Batch size analysis
FLASH runtime performance depends on the number of logs processed at a given time, a behavior regulated by the batch size parameter K. We conduct a comprehensive analysis to show the performance of our system at different batch sizes. When FLASH receives the system log, we use a sliding event window to process the system log.
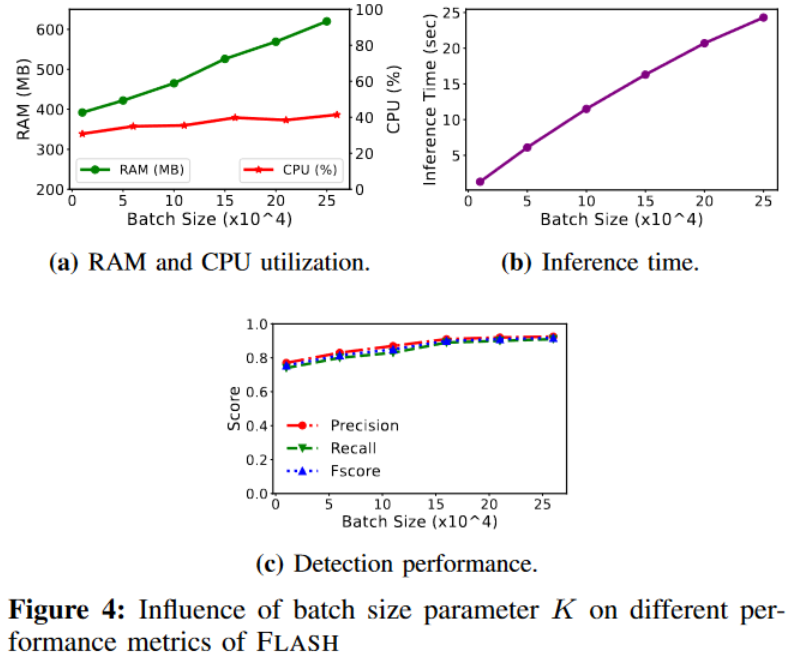
Figure 4a shows the impact of increasing batch size on runtime consumption of CPU and memory resources. Interestingly, CPU utilization remains relatively constant, while memory consumption grows almost linearly with batch size, peaking at approximately 600 MB for an event window size of 250K. These observations indicate that FLASH is good at utilizing system resources efficiently even when processing large batches of data, making it suitable for real-time IDS. Figure 4b shows the inference time for different batch sizes using the OpTC dataset. The choice of event window size will also have an impact on FLASH detection performance. Smaller window sizes prevent complete capture of system node activity, resulting in reduced detection accuracy. Figure 4c shows the improvement in various accuracy measures for FLASH as the batch size increases. It is worth noting that performance increases until it reaches a certain threshold and then stabilizes. From these findings, it can be seen that the optimal choice of batch size depends on the resource constraints and requirements of the enterprise environment in which the FLASH system will be deployed. For systems with limited resources, a smaller event window size may be required, while high-performance systems with large event throughput can benefit from a larger window size.
# Robustness test
To evaluate FLASH’s resilience against adversarial attacks, we performed adversarial imitation attacks on source-based IDS, as detailed by Goyal et al. A noteworthy finding of Goyal et al. is the susceptibility of IDSs with graph-level granularity (as discussed in Section 2) such as Unicorn, StreamSpot, ProvDetector, and SIGL to adversarial attacks. This adversarial strategy manipulates the distribution graph encoding to launch evasion attacks against provenance-based IDS, with the goal of creating misleading similarities between the node neighborhood distribution in the attack graph and the node neighborhood distribution in the benign provenance graph. The goal of this strategy is to make nodes in the attack graph have similar embeddings as nodes involved in benign activities. To achieve this goal, we integrate the benign node structure in the training dataset into the attack graph, and FLASH encodes the structural information of the nodes in the origin graph using a GNN that collects feature vectors from the node’s parents through a message passing mechanism to create a D-dimensional vector representation based on the k-hop neighborhood of each node.
The attacker modifies the node neighborhood in the attack graph to make it similar to the node neighborhood in the normal behavior graph, with the goal of making the embedding of the attack node similar to that of normal nodes.
The experimental results are shown in Figure 5, which shows the number of edges added to the attack graph using benign structures (x-axis) versus the number of benign edges added by the anomaly scores (minimum, average, and maximum) of all attack nodes (y-axis). Initially, adding benign node neighborhoods reduces the anomaly score of the attacking node, but this reduction is not enough to ensure successful evasion, as shown by the threshold line in Figure 5 . Subsequently, as more benign edges are introduced, the anomaly score of the attacking node increases. This trend can be attributed to the fact that incorporating additional benign nodes around the attack node can enhance its embedding, endowing it with more benign features, thus reducing the node’s anomaly score.
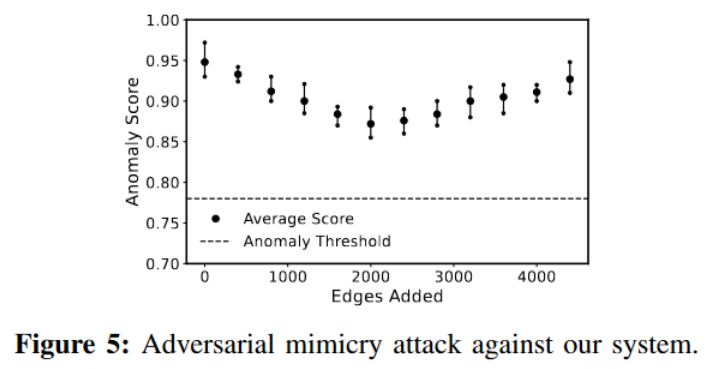
But constantly adding more benign nodes will raise suspicion in the model, and this change in the node distribution learned by the model will lead to an increase in the anomaly score. This unique behavior can be linked to our model’s powerful semantic understanding derived from node-level learning tasks. Through this process, FLASH can gain a comprehensive understanding of the feature neighborhood structure associated with nodes with different semantics in the source graph. This understanding enables the model to accurately judge the legality of causal relationships between different nodes in the graph, making FLASH highly resistant to adversarial imitation attacks. This resilience has significant advantages over graph-level detection methods.
# Ablation experiment
In the ablation study, we systematically evaluate the performance of FLASH by varying various parameter settings and components, demonstrating their impact on system effectiveness. Key areas we explore include
- The impact of different lightweight classifiers
- Use of weighted cross-entropy loss
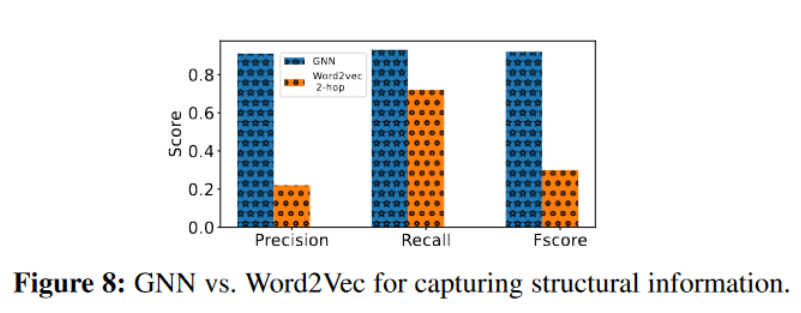
- Effectiveness of GNN embeddings relative to Word2Vec embeddings
- The role of timing coding

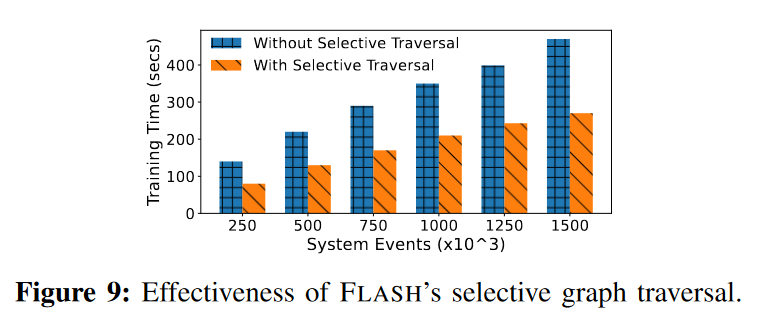
- Effectiveness of selective graph traversal.
The results, shown in Figure 9, show that the traversal technique can reduce GNN training time by 43% for a specified number of system events.
# Alarm effectiveness
FLASH’s primary design goal is threat detection, but it has the potential to also facilitate faster attack investigation. We focus on two main areas: managing threat alert fatigue and generating attack evolution graphs (AEG). Alert fatigue occurs when security analysts deal with too many threat alerts, leading to threats being overlooked in false positives. To evaluate whether FLASH can mitigate this issue, we ranked alerts based on the threat (anomaly) score assigned by FLASH. Figure 10 shows the cumulative distribution function of the ranking of true and false alarms. It shows that FLASH’s threat score prioritizes real alerts. Furthermore, if a separation threshold is established at the lowest true alarm score, up to 60% of false alarms can be discarded. This prioritization helps analysts focus on higher-scoring alerts, reducing the chance of overlooking real threats and minimizing attackers’ exposure time. In the case of AEG, these visual aids map the evolution of the attack, aiding analysts during alert validation. As shown in Figure 11, using AEG reduces the number of items that investigators need to review because there are fewer AEGs than a single alert. This investigation method is similar to the RapSheet system and allows for more efficient and targeted attack analysis. In contrast, ThreaTrace encountered difficulty in alert classification due to the use of multiple GNN models for prediction. An alert is triggered only when all models classify a node as an anomaly, resulting in each node having a different alert score from different models. The lack of a single representative anomaly score for each node poses a significant challenge to the classification process.

# Summary and discussion
Concept Drift. That is, the data distribution of the underlying system changes over time, which is a potential problem. For example, patterns learned by FLASH during training may no longer be valid as new system activity occurs. This drift may lead to misclassification, as new benign behaviors may be incorrectly identified as anomalies. One mitigation strategy is to periodically retrain with the latest data to update the model and embedding database. Due to its selective traversal, FLASH training is very efficient, enabling users to retrain their models regularly. However, this approach faces the challenge of maintaining the model’s ability to identify older but still relevant attacks. Unfortunately, there are currently no public datasets to evaluate the effectiveness of this strategy. Therefore, effectively handling concept drift in FLASH remains a challenge worthy of future research.
**Adaptive adversarial attacks. ** Various existing defenses can be integrated into Flash to increase its robustness against these attacks. For example, adversarial training [63] and gradient masking [50] are commonly used to defend against gradient-based attacks. The former involves augmenting the training dataset with adversarial examples to improve the robustness of the model, while the latter makes it difficult for an attacker to accurately calculate gradients to craft adversarial inputs. Techniques from previous work on defending against audit log tampering [14, 57] can be used to prevent training-time data poisoning attacks. These defenses can be easily incorporated into Flash to increase its resistance to adaptive adversaries.
# Related work
Rule-based IDS. Norm-based IDS methods, such as Holmes, Rapsheet, and Poirot, use canonical rules on a provenance graph to detect deviations from normal behavior. While these methods are effective in reducing false positives, they run the risk of being evaded by new attacks and require continuous updating to address the evolving threat landscape. Compared to these systems, FLASH is a more scalable and robust solution capable of detecting previously unseen threats by leveraging the rich semantic and contextual information in the provenance graph.
Based on embedded IDS. Embedding techniques are widely used for log analysis tasks, and they often use ML models (such as neural networks and n-grams) to convert logs into vector form. Examples include DeepLog using LSTM, ProvDetector applying Doc2Vec, and Attack2Vec leveraging a temporal word embedding model. Euler uses GNN and RNN embeddings to detect lateral motion. SIGL only focuses on detecting malware installations through deep learning and is limited by graph-level granular detection. Furthermore, SIGL’s evaluation is based on a small dataset of normal/malware installations, which makes scaling to large source graphs challenging. DeepAid [29] uses deep neural networks to detect anomalies in network traffic. Unlike these systems, FLASH is a host-based IDS that combines GNNs with rich semantic word embeddings from system logs and stores training-stage embeddings for real-time APT detection.
Source-based investigation. Hassan et al. exploit syntactic reasoning of source graphs to accelerate system intrusion investigation. Pasquier et al. introduce CamQuery, a real-time source analysis framework. Additionally, existing systems such as DEPCOMM, DEPIMPACT, Watson, NoDoze, Palantir, Deepcase, SAQL, OmegaLog, C2SR, Dossier, and Atlas facilitate attack investigation and incident response. These existing systems are orthogonal to our research direction as they are not designed to detect APT attacks and they require initial attack symptoms from an intrusion detector to initiate an investigation.