| Journal | 2019 SP |
|---|---|
| Authors | Sadegh M. Milajerdi, Rigel Gjomemo, Birhanu Eshete, R. Sekar, V.N. Venkatakrishnan |
| Status | Finished reading |
| Abstract | In this article, we introduce HOLMES, a system that implements a new approach to advanced and persistent threat (APT) detection. HOLMES was inspired by several case studies of real-world APTs that highlighted some of the common goals of APT actors. In short, the goal of HOLMES is to generate a detection signal that indicates the presence of a coordinated set of activities that are part of an APT campaign. One of the main challenges addressed by our approach is the development of a set of techniques that make detection signals robust and reliable. At a high level, the techniques we develop effectively exploit correlations between suspicious information flows that appear during attacker activity. In addition to its detection capabilities, HOLMES is able to generate high-level graphs summarizing attacker behavior in real time. Analysts can use this diagram to conduct effective network responses. An evaluation of our approach against some real-world APTs shows that HOLMES can detect APT activity with high accuracy and low false positive rates. The compact, high-level diagrams generated by HOLMES effectively summarize ongoing attack activity and can assist real-time network response operations. |
#mindmap
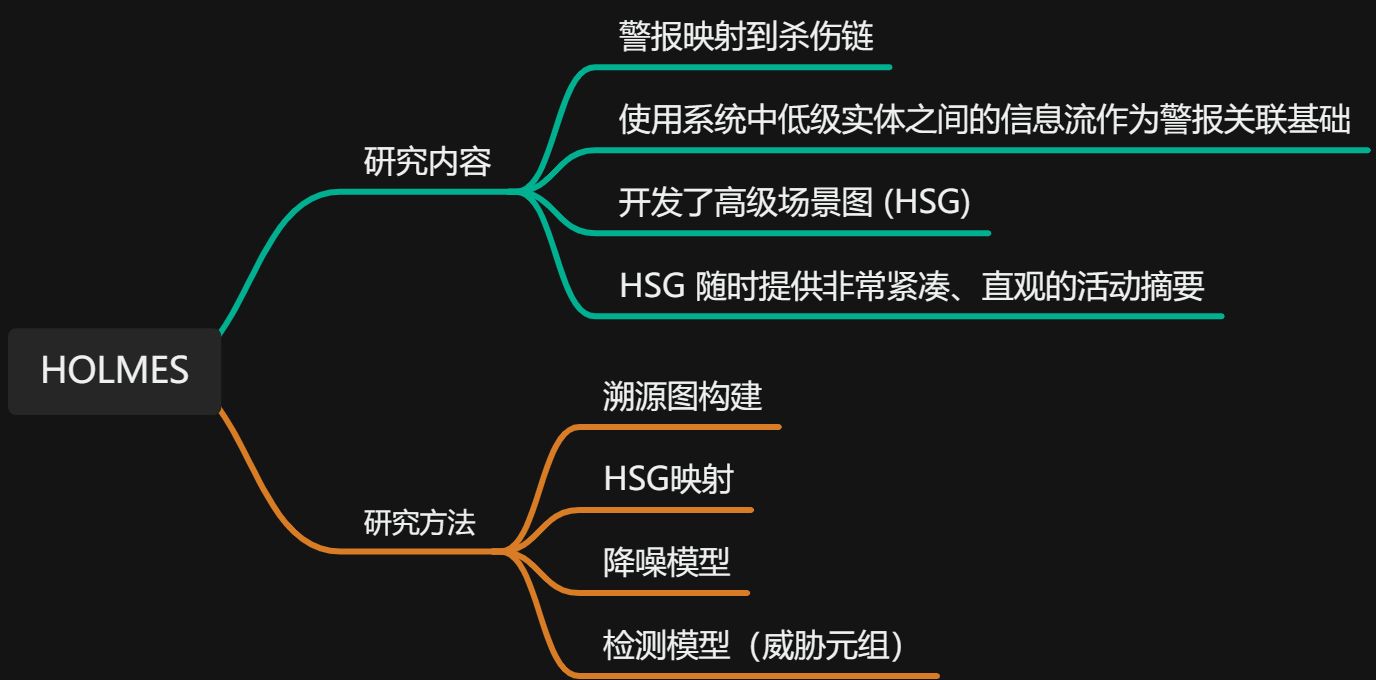
# Research content
# contribute
- HOLMES is designed to map activity found in host logs and any alerts found in the enterprise directly to the kill chain.
- The second important idea of HOLMES is to use the information flow between low-level entities in the system (files, processes, etc.) as the basis for alert correlation.
- The third major contribution of HOLMES is the development of high-level scene graphs (HSG). The nodes of HSG correspond to TTP, and the edges represent the information flow between entities involved in TTP.
- HSG makes an important contribution to attack understanding by providing a very compact, intuitive summary of activity at any time.
# challenge
- Stealth (malicious activities are difficult to detect)
- Low positivity (less malicious activity)
- Real-time (malicious activities are difficult to detect in real-time)
To overcome these challenges, note that despite seamless integration into benign background activity, two factors related to the attack remain prominent. First, the attack steps implement capabilities corresponding to certain APT stages. Second, attack campaigns are interconnected through information flows. In the next section, we describe the HOLMES method based on these two key observations.
# Kill chain model
 Initial Compromise: For example, website malware or spear phishing attack
Establish Foothold: Install Trojan backdoor
Escalation Privilege: Exploitation
Internal Reconnaissance: Internal reconnaissance target system information
Move Laterally: Penetration through lateral movement of the network
Maintain Presence: Command and Control (C&C), Remote Access Trojans (RATs)
Complete Mission: Disclosure of sensitive information
Initial Compromise: For example, website malware or spear phishing attack
Establish Foothold: Install Trojan backdoor
Escalation Privilege: Exploitation
Internal Reconnaissance: Internal reconnaissance target system information
Move Laterally: Penetration through lateral movement of the network
Maintain Presence: Command and Control (C&C), Remote Access Trojans (RATs)
Complete Mission: Disclosure of sensitive information
# research methods
# Idea goals
- The most basic advanced behavioral steps of APT
- Information flow dependencies between these steps
Challenge: A large semantic gap exists between low-level audit data and a high-level kill chain view of attacker goals, intent, and capabilities
# Bridging the semantic gap

# Key technologies
- Efficient matching (using a representation of the audit log as a directed source graph in main memory)
- Association relationships (building high-level scene graph HSG)
- Reduce false positives
- Learn benign patterns that may produce false positive TTPs;
- A heuristic that assigns weights to nodes and paths in the graph based on severity in order to rank HSGs and present the highest-ranked HSG to analysts
# Summarize
Advanced stages of APT are conducted using a common set of tactics that can be observed from audit data. These observations suggest that some malicious activity may be occurring. Well, **HOLMES’ job is to collect evidence and infer correlations between them, and use these correlations to plan the entire attack campaign. **
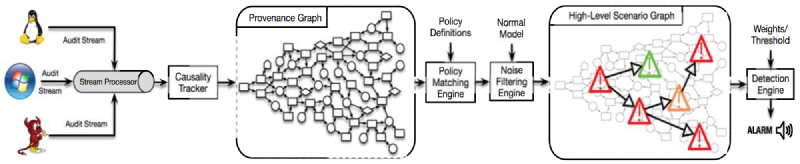
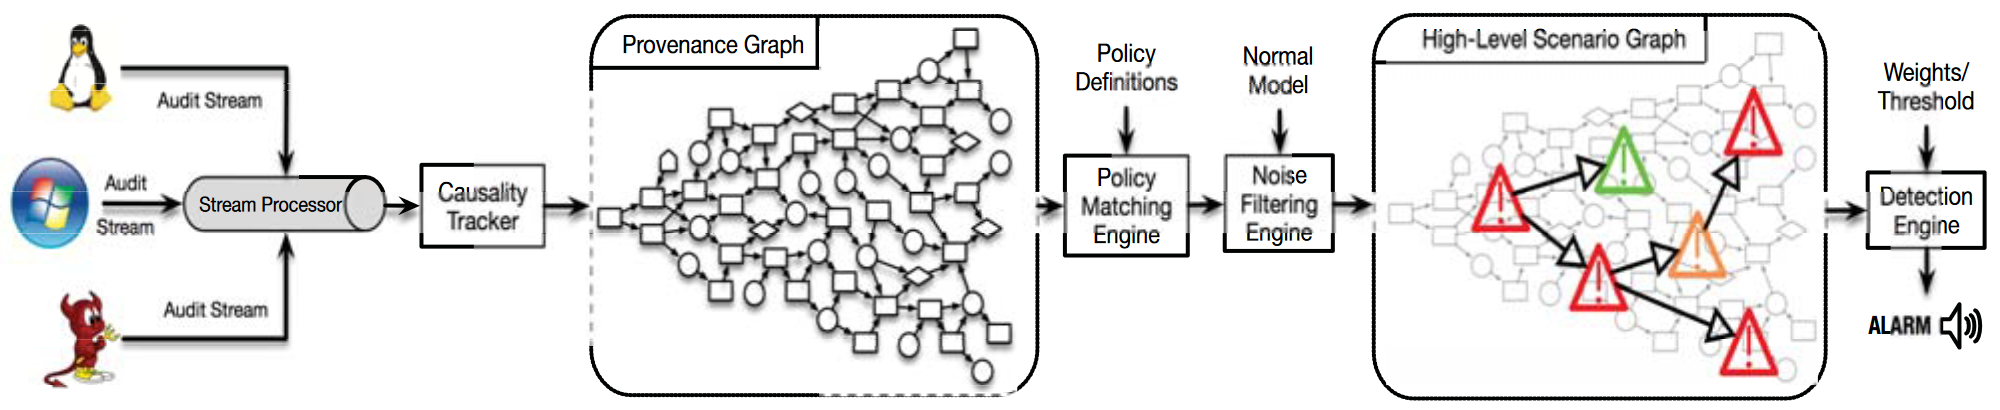
# system design
# A. Data Collection and Presentation
This design differs from previous work in two ways:
- The provenance graph is constantly changing: when an edge changes a node’s dependency, a new node is created and replaces the old node. This “versioned” approach allows the graph to be pruned without changing the analysis results, and this versioned graph is acyclic, which can simplify many graph algorithms.
- Another difference is that the provenance graph is stored in main memory, and each event occupies less than 5 bytes. This representation can consume events in real time and build a traceability graph over a long period of time.
# B.TTP specification
The TTP specification provides a mapping between low-level audit events and high-level APT phases, so this is the core of the approach proposed in this paper. TTP represents an intermediate abstraction layer between concrete audit logs and high-level APT steps. Specifically, mainly relies on two technologies to promote audit log data to the middle layer:
- OS-neutral representation in the form of traceability graphs of security-related events;
- Use information flow dependencies between entities involved in TTPs.
# C.HSG Build
 The construction of HSG is primarily driven by prerequisites. If all prerequisites for a TTP are met, then the TTP is matched and added to the HSG, which can reduce the number of TTPs in the HSG, allowing complex analysis to be performed without affecting real-time performance.
# D. Avoid false dependencies
Solve dependency explosion problem in HSG
- Ancestor coverage
Determining whether the flow represents a strong or weak information flow is equivalent to determining whether the entities in the flow share a compromised ancestor. If they share a compromised ancestor, then they are part of the attacker’s campaign and there is a strong dependency between them that must be prioritized. Otherwise, we consider the dependence to be weak and deemphasize it in the analysis.

- f represents an information flow path
- Only for all processes in f, does not affect non-process nodes
- Minimum ancestor coverage
$AC_{min}(f)$ represents the minimum number of ancestor nodes that an attacker needs to attack if he wants to control the entire information flow path.
- Path factor
$path_factor(N_1,N_2)$, considering all information flow paths $f_1,…,f_n$ from $N_1$ to $N_2$, $m_i$ is represented as the minimum ancestor coverage of $f_i$. Then, $path_factor(N_1,N_2)$ is the minimum value among $m_1,…,m_n$. The use of path factors greatly mitigates dependency explosion by prioritizing flows affected by the attacker.
# E. Noise reduction
One challenge in audit log analysis for attack detection and forensics is the presence of noise, i.e. benign events that match TTP rules. Long-lived processes such as browsers, web servers, and ssh daemons trigger TTP matches from time to time. To reduce these false positives, denoising rules based on training data are incorporated.
# Good prerequisite matching
For each process, the system learns prerequisites that are frequently triggered when the system is operating in a benign environment. At runtime, when a prerequisite for a triggered TTP matches a prerequisite encountered during training, the match is ignored.
# Number of benign data flows
The benign prerequisite matching method may lead to false negatives. For example, if a malicious event matches the benign prerequisites trained in a benign environment, then the malicious event may be ignored. For example, even if there is no attack, read /etc/passwd will be executed during the startup phase of nginx. However, if we whitelist this behavior, if there is a malicious event that reads and changes files, then the malicious event will be ignored. In order to solve the above problems, the concept of data flow quantity measured by byte transfer is proposed. For example, the number of data flows from /etc/passwd to nginx is equal to the size of the /etc/passwd file. Therefore, if more bytes are observed flowing from /etc/passwd to nginx, then this flow may be part of an attack. **To determine the critical point in traffic volume, we observe process-file and process-socket activity over a period of benign activity. **
# F. Information association and detection
Define a severity score for each HSG
- Threat tuple
The attacker’s progress in the campaign is first represented by an abstract threat tuple associated with the corresponding HSG. Especially for each HSG, the threat tuple consists of 7 elements <S1, S2, S3, …, S7>, where each Si corresponds to the threat level of the APT attack phase. An APT stage usually contains many APTs, and the ones with the highest threat level are selected to form a threat tuple.
- HSG ranking and prioritization
$\prod_i^n(S_i)^{w_i}\geq{\Tau}$ n represents the number of steps of the APT attack, wi and Si represent the weight and threat level of step i respectively, and T represents the threshold. If no TTP occurs in step i, we set Si to 1. [Problem: wi setting is more subjective and depends on the rationality of Si]
# Experiment
# Stream consumption of source graph construction
To achieve platform independence, audit records from different operating systems are standardized into a Common Data Representation (CDR) and provide a shared abstraction for various system entities. To simplify audit data processing, CDR-based audit records are published to a streaming server (Kafka) and consumed from the streaming server for real-time analysis and detection.
Md Nahid Hossain, Sadegh M. Milajerdi, Junao Wang, Birhanu Eshete, Rigel Gjomemo, R. Sekar, Scott Stoller, and V.N. Venkatakrishnan. SLEUTH: Real-time attack scenario reconstruction from COTS audit data. In 26th USENIX Security Symposium (USENIX Security 17), pages 487–504, Vancouver, BC, 2017. USENIX Association.
**Using the SLEUTH (USENIX’17) system for data flow consumption, utilizing causality tracing and provenance graph construction. **
# Rule matching engine and HSG construction
A particularly challenging part of this task is examining each TTP’s prerequisites and path factors for previously matched TTPs. To solve this challenge without backtracking (avoiding large operations), we use an incremental matching method to store previously calculated results and match and propagate pointers to these results along the graph.
# Noise filtering and detection engine
# Evaluate
To build the noise reduction model, we used 4 days of benign audit data. These programs include browsers (such as Firefox), web servers (such as Nginx), and various daemon processes (such as postfix, syslogd).
# Score results

# Performance evaluation
Graph Size HSG Size Memory Use Runtime
# Real scene
- False Positive
Putting the system in an environment of benign activity for two weeks, no false positives were found
- False Negative
Implicit causal relationships between TTPs: For information flow that avoids system calls, HOLMES cannot directly see the causal relationships between system entities. However, if the rest of the attack unfolds via system calls, HOLMES will still reconstruct parts of the attack. Multiple Entry Points: As an active evasion technique, an attacker may exploit multiple entry points to generate separate subgraphs. HOLMES tracks each individual entry point until our detection threshold is met, and correlates TTPs when there is information flow between disjoint subgraphs. However, some additional analysis may be required to fully correlate attack steps that come from different entry points without information flow between them.