
# Summary
Advanced persistent threat (APT) attacks continue to plague modern enterprises, causing significant financial losses. To combat these attacks, researchers have proposed techniques to capture complex and covert scenarios of APT attacks by modeling system entities and their dependencies using provenance graphs. In particular, in order to speed up attack detection and reduce economic losses, there is an urgent need for an online traceability detection system that can detect and investigate APT attacks under the constraints of timeliness and limited resources. Unfortunately, existing online systems often sacrifice detection granularity to reduce computational complexity and generate provenance graphs exceeding 100,000 nodes, which creates challenges for security administrators in interpreting detection results. In this paper, we design and implement NODLINK, the first online detection system that maintains high detection accuracy without sacrificing detection granularity. Our insight is that the APT attack detection process in online provenance-based detection systems can be modeled as a Steiner Tree Problem (STP), which has an efficient online approximation algorithm that can recover concise attack-related provenance graphs with theoretically bounded errors. To leverage the framework of the STP approximation algorithm for APT attack detection, we propose a novel memory cache design, an efficient attack screening method, and a new STP approximation algorithm that is more efficient than traditional algorithms in APT attack detection while maintaining the same complexity. We evaluate NODLINK in a production environment. Open-world experiments show that NODLINK achieves higher detection and investigation accuracy with the same or higher throughput, outperforming two state-of-the-art (SOTA) online traceability analysis systems.
# Research team introduction
Shaofei Li, Xiangqun Chen, Yao Guo ,Ding Li: Key Laboratory of High Trust Software Technology, Ministry of Education, School of Computer Science, Peking University
Feng Dong, Haoyu Wang: Huazhong University of Science and Technology, majoring in software analysis, privacy and security, electronic crime, Internet/system measurement and AI security
Jiedong Chen: Convinced
Xusheng Xiao: Arizona State University, focusing on mobile application analysis, network threat detection and investigation, blockchain/smart contract security, and software testing and debugging
Fei Shao: Case Western Reserve University
Representative work: Are we there yet? An Industrial Viewpoint on Provenance-based Endpoint Detection and Response Tools. (CCS'23)
# Background introduction
# APT Threat Detection
Advanced persistent threat (APT) attacks have become a major threat to modern enterprises. These enterprises’ existing endpoint detection and response (EDR) systems have difficulty responding to APT attacks due to a lack of ability to recover complex causal relationships between APT attack steps. As a result, practitioners and researchers now analyze system audit events in traceability data to recover APT attack scenarios. Unfortunately, most existing provenance analysis systems only support post-mortem analysis of EDR system alerts, which can delay accurate detection of APT attacks by a week and cause significant financial losses. A recent study showed that businesses lose approximately $32,000 per day when attackers have a persistent presence on their networks.
To this end, researchers built an online detection system based on traceability that can simultaneously detect and investigate APT attacks. Unlike post-mortem analysis systems, online detection systems based on traceability can detect and restore the logic of APT attacks within seconds after they occur, allowing security administrators to respond promptly and reduce potential losses. In addition, by comprehensively analyzing the entire APT attack activity instead of a single system event, the false positive rate of the traceability-based online detection system is much lower than that of the traditional EDR system, further improving the effectiveness and efficiency of APT attack investigation.
Despite these promising early results, building accurate online detection systems remains conceptually challenging due to limited resource constraints and high expectations for timeliness. Recent studies indicate that operating costs are a major bottleneck in industry adoption of EDR systems. Therefore, it is very important to reduce the operating costs of traceability-based detection systems. At the same time, people still expect detection systems based on traceability to detect APT attacks online in a timely manner. Unfortunately, achieving high detection accuracy under the constraints of timeliness and limited resources is particularly challenging because provenance data are highly structured graphs (called provenance graphs). Existing graph processing algorithms, such as graph neural networks [38] or iterative message passing algorithms [41], cannot be directly applied due to low efficiency.
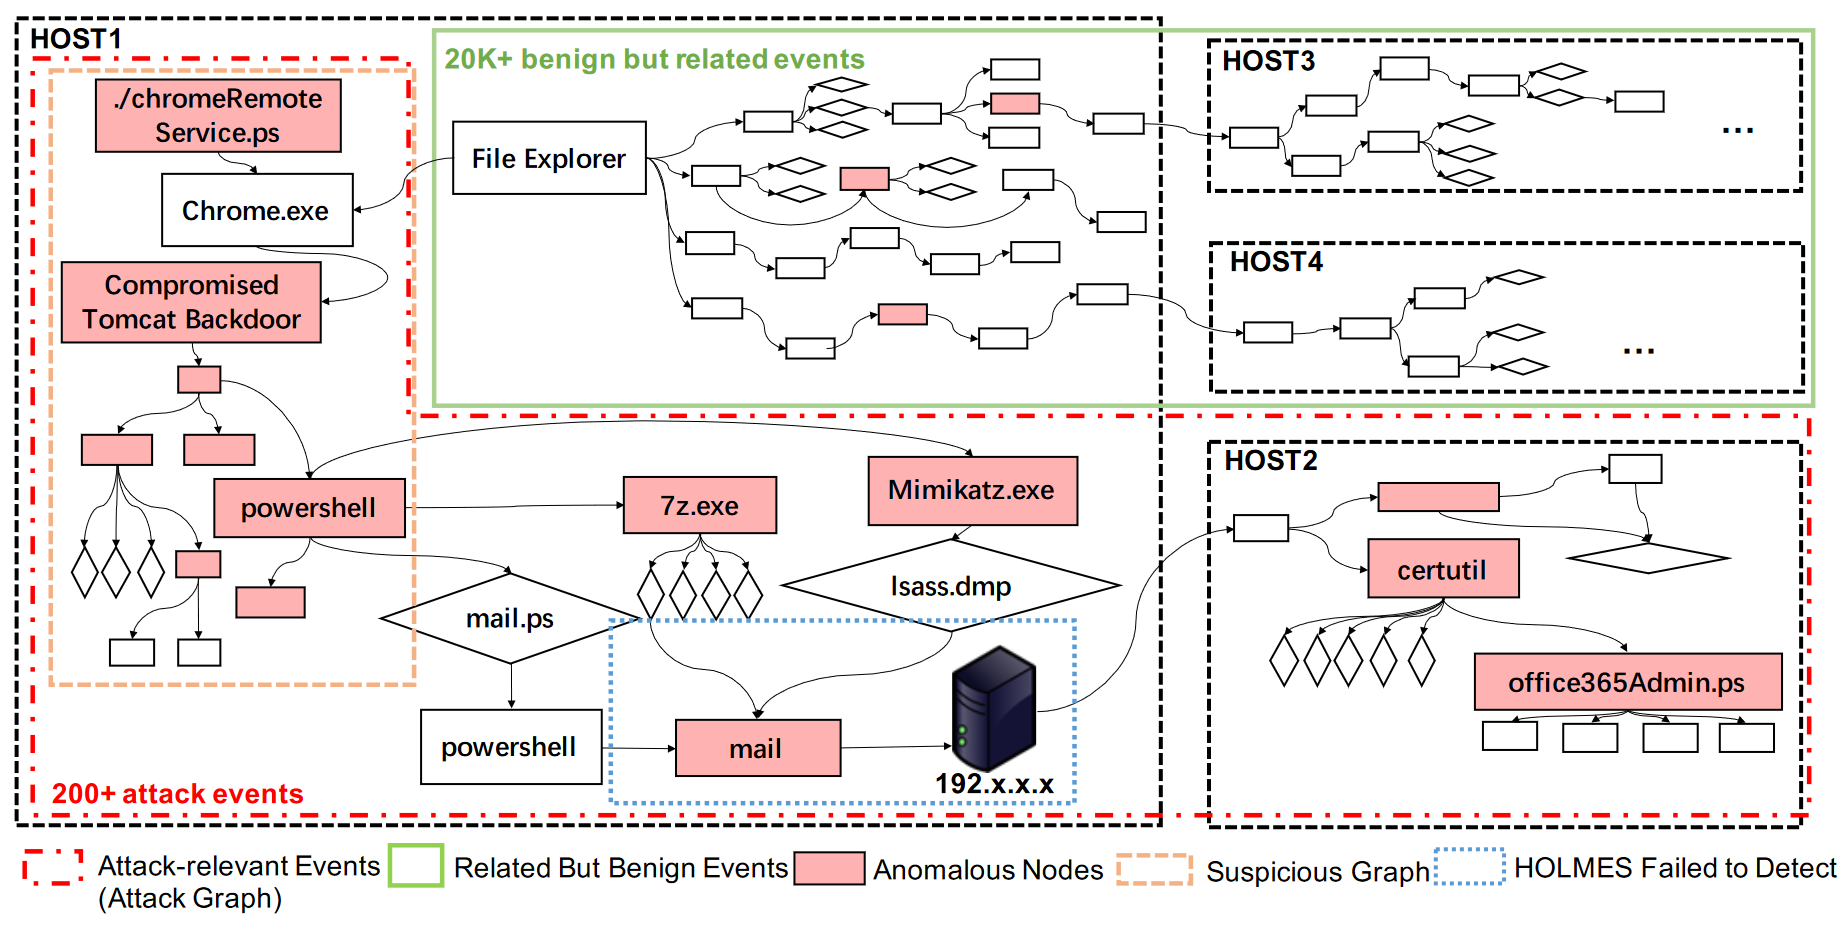
To address these challenges, recent provenance-based online detection systems use low-dimensional data structures or manually formulated rules to oversimplify highly structured provenance graphs. These systems reduce computational complexity by sacrificing detection granularity, and they make detection results difficult to interpret. For example, given an APT attack captured in attribution data, UNICORN, one of SOTA’s online detection systems, might generate an attribution graph with over 100,000 nodes. However, less than 100 nodes are associated with APT attacks. Therefore, identifying the attack steps represented by such a small number of nodes from the traceability graph is like “finding a needle in a haystack”, which is extremely difficult for security administrators.
The workflow of APT detection based on traceability consists of three steps:
- Candidate attack detection, selecting indicators of compromise (IOC) or abnormal events;
- Traceability graph construction, using nodes representing system entities and edges representing entity interactions (such as reading/writing files) to construct a graph to reveal interactions between IOCs or exceptions;
- Comprehensive detection, detect APT attacks based on the traceability graph constructed in step 2.
Among these three steps, the quality of the traceability map constructed in step 2 is the key to accurate and fine-grained detection. Unfortunately, it is challenging to construct the most concise and accurate traceability diagram that reveals the interactions between IOCs or anomalies. Existing methods use heuristics that either oversimplify the provenance graph, miss critical information, or are too burdensome for online detection systems. Therefore, they cannot be concise, efficient, and accurate at the same time.
In this paper, we propose the FIRST online detection system, which achieves fine-grained detection under the constraints of timeliness and limited resources while maintaining detection accuracy. Existing methods cannot achieve the simplicity, efficiency, and accuracy of APT detection simultaneously because they suffer from a fundamental limitation: the lack of a formal model for APT detection of multiple targets. Therefore, to address this fundamental limitation, we propose to model provenance graph construction (step 2 of provenance detection) as an STP (Steiner Tree Problem), which can efficiently model multiple targets and has efficient online capabilities for approximate solutions with theoretically bounded errors. Think of IOCs or exceptions as a predefined set of nodes (i.e. terminals) in STP and assign the same non-negative weight to every interaction between system entities. Then, building the provenance graph can be modeled as an online STP, which searches for subgraphs that link all anomalies with a minimum number of edges. By doing this, we can design an approximation algorithm that ensures that the subgraph has a minimal edge within a theoretically bounded error in polynomial time.
While this sounds promising, there are three main challenges in solving the problem of STP-based APT attack detection.
- The first one is how to detect long term attacks? STP requires understanding the entire source picture in advance. However, keeping all source data in memory is not possible due to data size, and storing it in a disk database is impractical due to I/O bottlenecks. The straightforward approach of using a time window where only the latest data is saved does not always work, as the attacker may need more time than the window allows. To address this issue, we propose a novel memory cache design that employs a scoring approach to prioritize events that may lead to APT attacks and capture long-running attacks within the STP’s time window.
- The second challenge is how to efficiently identify terminals in STP? Existing detection methods rely on dense random walks and message passing on the source graph, which is not suitable for online systems. To address this problem, we design an IDF-weighted three-layer variational autoencoder (VAE) that requires minimal computation.
- The third challenge is that the current STP approximation algorithm is still not efficient enough for APT attack detection. Existing methods require finding the shortest path between two nodes, which is too costly for online APT attack detection. To address this problem, we develop an importance-oriented greedy algorithm for online STP optimization that achieves low computational complexity with a limited competitive ratio.
Main contributions:
- We model APT detection as online STP, which provides a new perspective for online APT detection.
- We designed and implemented the online APT detection system NODLINK, which implements timely and fine-grained detection of limited resources based on STP.
- We evaluate NODLINK in a real production environment. To the best of our knowledge, this is the first open-world evaluation of source-based APT attack detection.
# Limitations of existing technology
Existing source-based detection systems can be divided into two categories: rule-based systems and learning-based systems. Many examples in both groups demonstrate the ability to achieve practical graphics-level accuracy. However, existing systems cannot achieve sufficient node-level precision and node-level recall simultaneously.
Rule-based systems have lower node-level accuracy due to incomplete rule sets. For example, HOLMES, one of the SOTA rule-based systems, cannot detect the attack steps in the blue dotted box in Figure 1. The reason is that HOLMES’s rules are initiated from an external untrusted IP, and the mail process does not have a direct connection to the external IP address. Therefore, the HOLMES output plot of the attack in Figure 1 is fragmented. The attack steps on HOST2 cannot be linked to the attack steps on HOST1, which brings challenges to root cause analysis. Furthermore, rule-based systems produce many false positives at the node level because rules cannot model all characteristics of dynamic systems well.
On the other hand, learning-based systems suffer from lower node-level accuracy due to over-approximation. To support online detection, existing learning-based methods project source graphs into low-dimensional data structures to reduce computational complexity, leading to over-approximation. For example, UNICORN, an online detection method based on SOTA learning, converts source graphs into hash vectors. Therefore, UNICORN is unable to pinpoint attack-related nodes in Figure 1 (shown in red dashed boxes) from benign data (shown in green dashed boxes), resulting in low node-level accuracy (<1%).
# Online STP
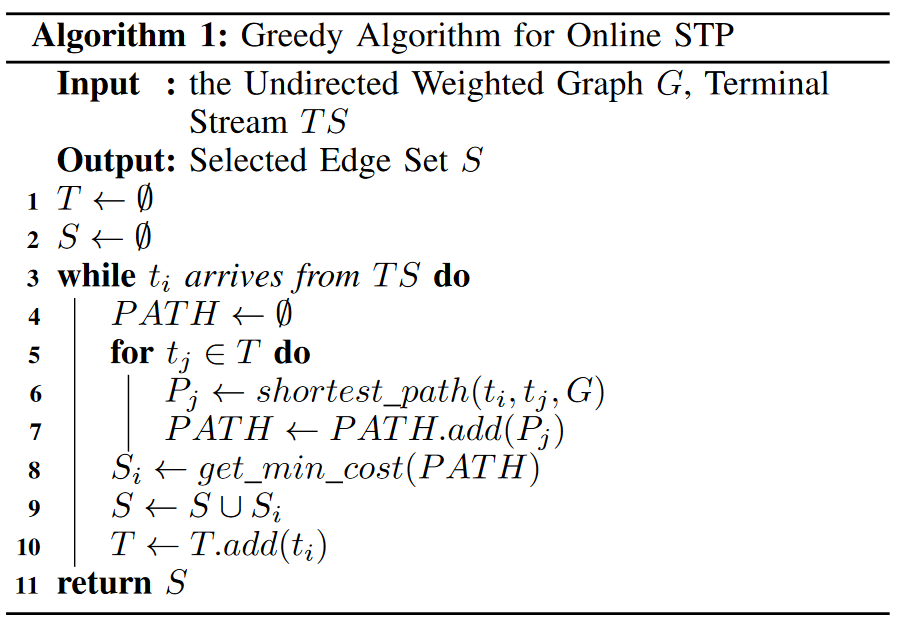
Online STP is a combinatorial optimization problem determined to be an NP-complete problem with bounded approximation. Given an undirected graph G = (V, E) with non-negative edge weights, we display for each edge e ∈ E and a series of online vertices (called terminals) T = {t1, t2,… , tk}, which outputs a subgraph Si of G spanning {t1, t2,… , ti}. The goal is to minimize the total cost of $c(\bigcup_i^kS_i)$.
The general framework of the online STP optimization algorithm is shown in Algorithm 1. For each arriving new terminal ti, we choose the set Si of unselected edges connecting ti to the current solution of the algorithm. The set Si is chosen as the cheapest one with the smallest weighted edge among all possible sets connecting ti to existing terminals. To find this set, it uses a greedy approach: it computes the shortest path Pj between ti and each previous terminal tj (where j < i), and then selects the cheapest path as Si. We add Si to the solution and repeat this process until all terminals are reached. The final solution is the union of all sets Si.
# Method overview
# Anomaly detection method:
- Memory cache design: Design the memory cache to maintain the latest abnormal nodes, support the tracking of long-term attacks and maintain algorithm performance.
- Terminal Identification: Identify suspicious process nodes as terminals by analyzing system audit events and using machine learning models (such as VAE).
- Hope set construction algorithm: Construct a Hope set based on a search algorithm guided by the importance score, which takes into account the node’s anomaly score and the distance from the terminal.
- Importance score calculation: Calculate the importance score of each node, which combines the node’s anomaly score, distance from the terminal and FANOUT factor.
- Graph Anomaly Score: Each Hopp set is assigned a graph anomaly score (HAS), which is the sum of the anomaly scores of all nodes in the Hopp set.
- Comprehensive detection: Merge the Hope sets constructed within the time window, and use statistical methods such as Grubbs test to detect abnormally high-scoring Hope sets to identify APT attacks.
- Theoretical Analysis: Conduct a theoretical analysis on the complexity and competition ratio of the algorithm to ensure the effectiveness and efficiency of the approximate algorithm.
Generally speaking, NODLINK is an online APT attack detection system. It accepts an event stream of system-sourced events collected from an agent installed on the monitored host. The output of NODLINK is a concise alert source graph containing key attack steps, Figure 1 shows an example of an alert source graph (marked by a red dotted box, which contains approximately 200 events).
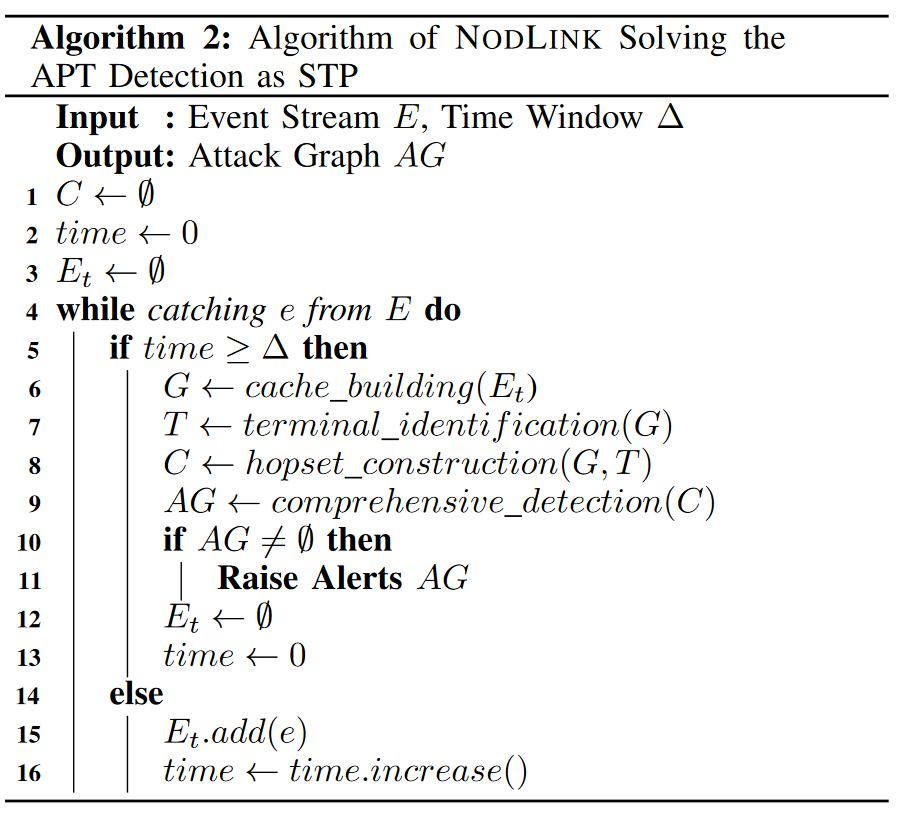
Algorithm 2 shows the high-level workflow of NODLINK, which is similar to existing detection systems. Our NODLINK algorithm detects anomalies every Δ (Δ = 10 in our implementation) seconds through four stages:
- In-memory cache build (line 6)
- Terminal identification (line 7)
- Hopset construction (line 8)
- Comprehensive detection (line 9)
We obtain events and store them in cache, allowing NODLINK to track the cause and effect of long-running attack events in memory without suffering from the performance bottlenecks caused by slow I/O. Identifies suspicious processes and assigns an anomaly score based on local characteristics such as command line, process name, and files accessed. A Hopset is built for each terminal to connect topologically close event-level anomalies. Finally, we merge the hopset with the cache and report any subgraph with a biased anomaly score as an alert to reduce false positives.
The key novelty of our approach lies in the third stage of Hopset. Existing methods either use heavy graph learning algorithms or error-prone heuristics. In our approach, we propose an online STP-based approach that ensures simplicity, accuracy, and efficiency. To model APT attack detection on the origin graph as STP, we treat the attack-related processes as terminals and convert the directed graph into an undirected graph with each edge having equal non-negative weight w, which for simplicity, w = 1. It helps us model terminals that have no direct causal relationship but have dependencies on the same node. Therefore, the purpose of APT detection is to first identify the terminal set T and find the edge set S that can connect all attack-related nodes and have the smallest total weight $c(S)=\sum_{(u,v)\in S}W_{uv}$, that is, it is a standard STP formula. Our system then issues an alert if the aggregate anomaly score of a node in the Steiner tree is greater than a threshold.
# Memory cache
The time window of NODLINK is designed as a memory cache to solve long-running attacks and maintain the efficiency of the online STP optimization algorithm. It maintains the latest abnormal nodes in memory and evicts outdated benign nodes to disk.
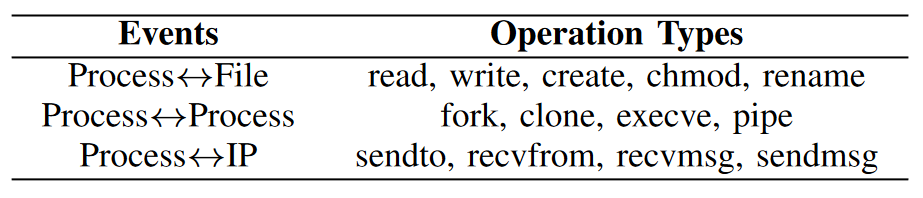
In our design, the memory cache contains the edges of the origin graph in the form <srcid, dstid, attr>, where srcid and dstid are the IDs of the edge’s source and destination respectively, and attr is the edge’s ID. Edge properties, including operation type and timestamp. Table 1 lists the edge types and their available operation types. NODLINK also stores the necessary attributes of the nodes in the directed graph, namely processes, files and IP addresses. For processes, NODLINK stores their command line, process name, pid, and uid. For files and IPs, NODLINK stores their paths and IPs and ports respectively.
Cache updates: Normally, the in-memory cache buffers subgraphs
- Have a high anomaly score and
- Actively evolving.
An in-memory cache updates the solution for the STP in the current time window every time window of length Δ, and NODLINK leverages the in-memory cache to achieve global STP solutions and false positive reduction.
NODLINK organizes subgraphs in the cache into hopsets and provides a hopset anomaly score (HAS) for each hopset. At a high level, a skip set is a subset of the origin graph that contains local contextual information for a set of event-level anomalies. HAS represents the abnormality degree of each hopset.
# Terminal identification
In terminal identification, NODLINK scans the memory cache and identifies suspicious process nodes as terminals based on their node-level characteristics. Note that while NODLINK’s output only includes anomalous processes, it does take into account anomalous files and IP addresses. NODLINK merges unusual files and IP addresses into the processes accessing them. The logic behind this design decision is that malicious files and IPs cannot take effect until they are accessed by a process. Therefore, focusing on anomalous processes can reduce duplicate alerts on files and IPs without losing node-level accuracy. NODLINK analyzes three types of node-level characteristics: the command line that starts the process (command line), the files accessed by the process (file), and the IP address accessed by the process (network). Terminal identification consists of two steps: first, it embeds process nodes into numerical vectors based on node-level features. Second, it uses machine learning models to detect anomalies.
Offline model training: Although NODLINK is an online detection framework, it requires offline training of FastText models, VAE models, SV models, and thresholds for proposing anomalies from historical data. NODLINK trains FastText models on command lines, file paths, and IP addresses in historical data. NODLINK then uses the trained embedding vectors to further train the VAE model. NODLINK calculates SV offline by periodically running the DBSCAN algorithm on historical data. It first classifies process embedding vectors into different groups. The process name and its cluster number are then stored in an in-memory hash table for online anomaly score calculation.
# Function
- Identify attack entry points: The purpose of terminal detection is to identify abnormal or suspicious nodes that may indicate the start of an APT attack. These nodes can be regarded as the “entry points” or “terminals” of the attack.
- Identify attack-related entities: By detecting abnormal behaviors or characteristics, terminal detection helps determine system entities directly related to APT attacks, such as malicious processes, files, or network connections.
- Reduce False Positives: Accurately identifying attack-related terminals can reduce false positives, as these detection results will be used in subsequent Hope set construction and attack graph generation to focus on the events most relevant to the attack.
- Improve detection accuracy: Terminal detection recovers APT attack scenarios by analyzing system audit events, improving the detection accuracy of attack steps.
- Support rapid response: Quickly and accurately identify attacking terminals allowing security administrators to respond promptly and take measures to curb the spread of attacks and reduce potential losses.
- Basics for building attack graphs: Terminal detection provides basic nodes for building attack graphs. These nodes are the key to subsequent construction of Hope sets and reconstruction of attack scenarios.
- Optimize resource allocation: By identifying the most critical attack nodes, the system can more effectively allocate resources, such as computing and storage, to process the data most relevant to the attack.
- Assisted attack investigation: The results of terminal detection can assist security analysts in understanding the origin, scope and potential impact of the attack, so as to conduct attack investigation and post-event analysis more effectively.
# method
- Embedding Based on Node-Level Features:
- NODLINK first embeds node-level features such as command lines, accessed files and IP addresses of process nodes into numerical vectors. This step uses natural language processing (NLP) technology to convert command lines, file paths, and IP addresses into natural language sentences, and then uses document embedding tools such as FastText to convert the sentences into numerical vectors.
- Anomaly Score Calculation:
- Use a variational autoencoder (VAE) model to calculate anomaly scores for each process node. The VAE model takes an embedding vector as input and outputs a reconstructed input vector. If the reconstructed vector is significantly different from the original embedding vector, the node is more likely to be an anomaly.
- Stability Score:
- To reduce false positives caused by unstable processes (such as those that frequently access random files or IP addresses), NODLINK introduces a Stability Score (SV), which is based on the number of clusters of processes with the same name in historical data.
- Comprehensive Anomaly Score:
- NODLINK combines the reconstruction error (given by the VAE model) and the stability score to calculate a comprehensive anomaly score for each process node. The anomaly score is calculated as: $AS(p) = \log\left(\frac{RE(p)}{SV(p)}\right)$ where 𝑝 is the embedding vector of the process, 𝑅𝐸 is the reconstruction error given by the VAE model, and 𝑆𝑉 is the stability score of process 𝑝.
- Terminal Determination:
- A process node is marked as anomaly (terminal) if its combined anomaly score is higher than the 90th percentile of anomaly scores in historical data. This threshold is commonly used in VAE basic anomaly detection to ensure the generalization ability of the method.
- Offline Model-Training:
- Although NODLINK is an online detection framework, it requires offline training of FastText model, VAE model, SV model and threshold for determining anomaly scores on historical data.
# Hopset build
After detecting a terminal in terminal identification, NODLINK runs Hopset Construction to resolve STPs within the current time window. The hop set within a certain time window is the neighbor context of each terminal, which includes bounded neighbor nodes and paths to these nodes. NODLINK utilizes a greedy algorithm, which we call the Importance Score Guided Search (ISG) algorithm, to construct hop sets based on local information (such as AS and node degree). Hopset Construction outputs an STP approximate solution with low complexity and finite competition ratio.
Graph Anomaly Score Calculation: The final step in Hopset construction is to assign the anomaly score HAS to each hopset. We define the HAS of a hopset as the sum of all anomaly scores $has(H_i)=\sum_{n\in H_i}AS(n)$ for all nodes in the hopset. Note that since NODLINK already excludes unimportant nodes based on IV, nodes in the hopset may be relevant to the attack. Therefore, the sum of ASs only includes nodes that are most likely to be relevant to the attack. This design helps improve the node-level accuracy and graph-level accuracy defined in terminal identification by avoiding events unrelated to attacks.
# Function
- Local context capture: The Hope set contains the neighbor context of each terminal (i.e., the abnormal node related to the attack), which includes bounded neighbor nodes and paths to these nodes. Through the Hope set, the system can capture the local details of the attack behavior.
- Anomaly Detection and Identification: Hopeset helps the system identify attack steps by connecting event-level anomalies, thereby enabling fine-grained detection of APT attacks.
- Reduce False Positives: By focusing on abnormal nodes related to the attack, the Hope set helps reduce the interference of benign events unrelated to the attack, thereby reducing false positives.
- Support rapid detection: The Hope set is constructed to be combined with the online STP approximation algorithm to quickly respond to new attack evidence and achieve real-time detection.
- Attack Scenario Reconstruction: The Hop set provides logical connections between attack steps, which is crucial for reconstructing a complete attack scenario.
# method
- Importance score-based search: NODLINK uses an indicator called the importance score (Importance Score, IV) to guide the search process. This score takes into account the node’s anomaly score and distance from the terminal.
- Greedy Search Algorithm: Hope set construction adopts a greedy search algorithm, which starts from each terminal and explores neighbor nodes based on importance scores.
- Node Selection: During the search process, NODLINK selects those nodes with higher importance scores to ensure that the Hope set contains the events most relevant to the attack.
- Bounded search range: In order to control the size of the Hop set and improve efficiency, the search process will stop when the preset number of nodes (θ) is reached.
- Merge overlapping Hopsets: During greedy search, if there are overlapping Hopsets, NODLINK will merge them to connect terminals efficiently.
- Anomaly Score Assignment: Each Hop set will be assigned a Hop set anomaly score (HAS), which is the sum of the anomaly scores of all nodes in the Hop set and is used to evaluate the anomaly degree of the Hop set.
- Update and Maintenance: In each time window, NODLINK will update the cached Hop set in memory and merge it with the Hop set built in the current time window to maintain the reflection of the current attack scenario.
Through the construction of Hope sets, NODLINK can effectively identify and connect relevant events in APT attacks, achieving rapid and accurate detection of attack behaviors while maintaining a fine-grained understanding of attack scenarios.
# Comprehensive detection
In order to conduct comprehensive detection, NODLINK first updates the cached hopset in memory with the hopset constructed in the current time window. If the hop set for the current time window has the same nodes as the hop set in the cache, NODLINK merges them. However, if we merge hopsets directly, in the worst case, long-running processes will be recognized as terminals and update θ different neighbors in each time window, which may lead to dependency explosion. To prevent this, we limit the number of hops per terminal to θ nodes and replace nodes with lower IV values with nodes with higher IV values when merging.
After the hop sets are merged, NODLINK assigns the HAS to the updated hop sets. In this way, we can concatenate the STP solution for each time window with the global solution to reconstruct long-term attack activity. NODLINK then utilizes the Grubbs test to detect hopsets with unusually high HAS. Grubbs’ test detects whether the maximum value in a set of samples is an outlier. We choose the Grubbs test because it is non-parametric and robust to contaminated training data sets. NODLINK runs the Grubbs test on the memory cache for multiple rounds until no outliers are flagged. Finally, detected anomalies are identified as attack activity and alerts are issued.
# Function
- Integrated detection results: Comprehensive detection is responsible for integrating the local detection results obtained through the Hope set construction in different time windows to form a global attack detection perspective.
- Improve detection accuracy: By merging and analyzing each Hope set, comprehensive detection helps improve the detection accuracy of APT attacks and ensure that no attack steps are missed.
- Reduce False Positives: Comprehensive detection identifies unusually high-scoring Hope sets by merging Hope sets and applying statistical tests, which helps distinguish true attacks from false positives.
- Attack Scenario Reconstruction: Comprehensive detection helps reconstruct the complete APT attack scenario, which is crucial for understanding the full picture of the attack, the attacker’s behavior, and the impact of the attack.
- Timely Response: Comprehensive detection provides security administrators with timely attack detection results, allowing them to respond quickly and take measures to stop the attack.
- Statistical Analysis: Comprehensive detection uses statistical methods (such as Grubbs test) to analyze the abnormal scores of the Hope set to further verify the existence of the attack.
# method
- Update cached Hop set: At the end of each time window, NODLINK updates the cached Hop set in memory, merging the newly constructed Hop set with the cached Hop set.
- Merge Hope Set: If the Hope set built in the current time window has the same nodes as the Hope set in the cache, NODLINK will merge them. When merging, the importance score (IV) is considered to decide which nodes to keep.
- Limit Hope Set Size: To prevent dependency explosion, NODLINK limits the Hope set size of each terminal and replaces nodes with lower IV values when merging.
- Calculate graph anomaly score: Calculate a graph anomaly score (HAS) for each Hop set, which is the sum of the anomaly scores of all nodes in the Hop set.
- Applied Statistical Tests: NODLINK uses statistical methods such as the Grubbs test to detect abnormally high HAS hope sets that may indicate attack activity.
- Identification of attack activities: Through multiple rounds of Grubbs testing, NODLINK identifies abnormal Hop sets and marks them as attack activities, subsequently triggering alerts.
- Generate attack graph: The results of comprehensive detection are used to generate an attack graph, which shows the steps of the APT attack and the dependencies between related entities.
# Experimental evaluation
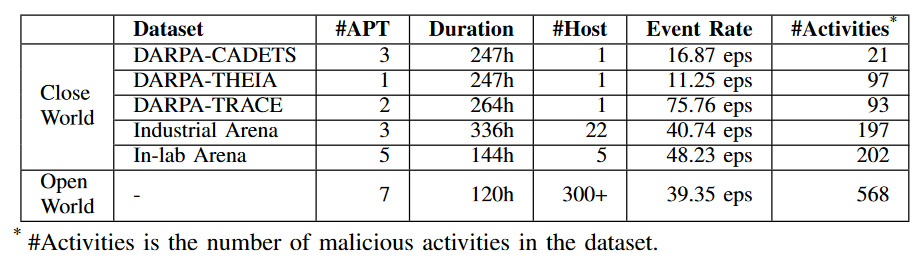
# Dataset
# Graph granularity accuracy
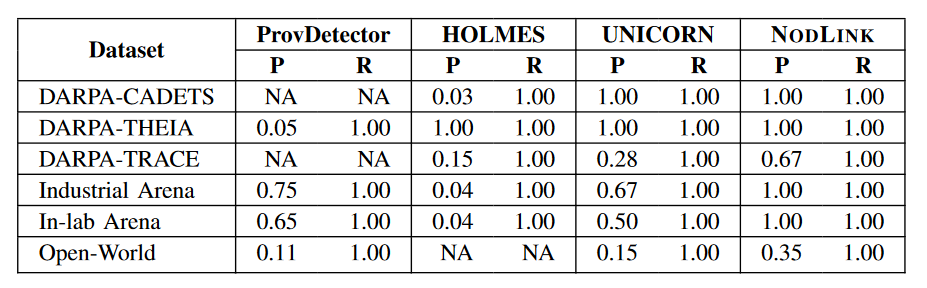
Close-World Result: As shown in Table 3, although these systems can detect all attacks, they report more false positives than NODLINK. Specifically, ProvDetector, UNICORN, and HOLMES generate 783, 14, and 416 GF Ps. In contrast, NODLINK reports only one false positive in these datasets.
ProvDetector was unable to detect the attack in DARPA-CADETS and was also unable to detect it on DARPA-TRACE due to memory limitations. It also has the lowest graphics-level accuracy on DARPA-THEIA because it cannot handle browser activity that explodes dependencies. For example, ProvDetector incorrectly reported false alerts when Firefox connected to a new IP address. UNICORN has lower graph-level accuracy because it overapproximates the origin graph. UNICORN projects source images to numerical vectors for detection. This step reduces its graphics-level accuracy. HOLMES has more GF P because its rules are too conservative. For example, if a process runs a command-line utility after accessing an untrusted IP address, HOLMES’ command-line utility rules will flag the process as an anomaly. This rule can generate a large number of false positives for long-running processes such as Nginx: all shell command executions forked by the Nginx process will be marked as exceptions once the Nginx process receives a connection from an untrusted IP. While building more complex rules can improve the accuracy of HOLMES, taking into account the heterogeneity of the system and the number of different types of system activities is tedious.
Open-World Results: The results are consistent with those from the close-world experiment. NODLINK has lower node-level accuracy in open-world experiments because the signal-to-noise ratio is much lower in open-world experiments. NODLINK outperforms the baseline. In particular, HOLMES failed to detect any attacks in open-world experiments because its rule set lacked rules for detecting webshells and handling hijacking attacks. Unfortunately, the attacks in the open world experiment all leveraged webshell and related attacks to hijack running processes to remain invisible. Therefore, HOLMES failed to capture any of them.
# Node granularity accuracy
![Table 4: Node-level accuracy of NODLINK and baseline. PI, HI and UI represent the improvements of NODLINK relative to ProvDetector, HOLMES and UNICORN respectively] (media\image-20240525111326024.png)

**Close-World Results: ** NODLINK’s node-level accuracy is comparable to the offline solution ProvDetector. For online solutions, NODLINK is one to two orders of magnitude better than HOLMES and two to three orders of magnitude better than UNICORN.
For node-level recall, NODLINK captures most of the attack steps in its reported source graph. On average, NODLINK covers 98% of attack-related incidents. The missing steps are related to reconnaissance, such as running “whoami”, “ipconfig”, “tasklist” and “systeminfo” to gather information about the system. NODLINK captured all steps related to running attack payloads and lateral movement in our experiments. HOLMES has lower node-level recall because it lacks rules to detect multiple attack steps. For example, it cannot detect attack steps initiated by internal files.
UNICORN’s node-level recall cannot be measured because it simply reports all events in the source graph, regardless of whether the events are attack-related or not. Therefore, although UNICORN captures all attack steps in its reported source graph, its node-level accuracy is much lower than other methods. Furthermore, UNICORN is incompatible with other investigation techniques, as all investigation techniques require a suspicious node or edge of the IOC to initiate an investigation. UNICORN does not produce IOCs as a starting point for investigative techniques. Instead, it generates a source graph containing the attack. Therefore, we cannot combine UNICORN with a post-processing step to improve its node-level accuracy.
Open-World Results: Data from HOLMES was skipped because it failed to detect any attacks in the open-world experiment. Overall, the results are consistent with those from close-range experiments. NODLINK achieves the same node-level recall as UNICORN, but with two orders of magnitude better node-level precision.
# Operating efficiency
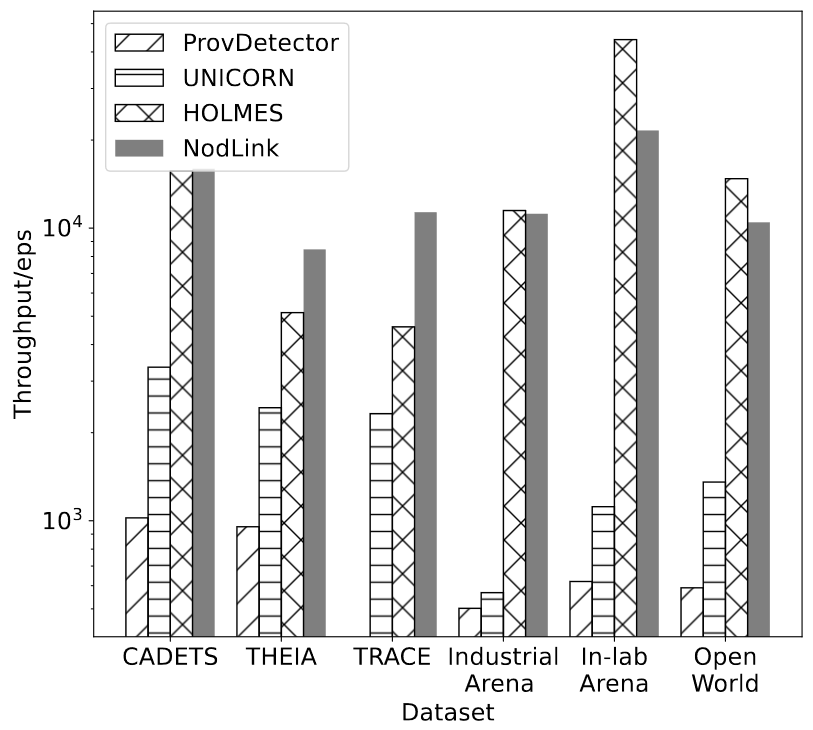
Evaluate NODLINK’s effectiveness in detecting APT attacks in a timely manner by measuring throughput, defined as how many system events it can process per second.
Time complexity theoretical analysis: ProvDetector first extracts all paths in the provenance graph and calculates the regularity score of each event. It then converts detection into finding the K longest paths on a directed acyclic graph, a problem solved by Epstein’s algorithm with time complexity O(E + N log N ). HOLMES processes the source graph through a policy matching engine. Therefore, its time complexity is O(E), where E is the number of edges. UNICORN constructs graph histograms with complexity O(R * E) and generates graph sketches in real time using HistoSketch, where R is the number of hops and E is the number of edges, as claimed in the paper. Remember, the complexity of NODLINK is O(θN ). Therefore, our analysis predicts that NODLINK and HOLMES are significantly faster than ProvDetector and UNICORN.
Experimental analysis: As shown in Figure 2, the y-axis is the number of events processed per second in each data set. Overall, the throughput of NODLINK is comparable to that of HOLMES. NODLINK has higher throughput in DARPATHEIA and DARPA-TRACE, while HOLMES has higher throughput in In-lab Arena datasets and open-world experiments.
HOLMES operates in two phases:
(1) Matching strategies, techniques and procedures (TTP) to source data
(2) Link TTP to high-level scene graph (HSG)
However, HOLMES failed to match some key steps in both the in-lab and open-world datasets, as shown in Table 5. Failure of the first stage eliminates the need for the second stage, resulting in higher throughput performance of HOLMES in both datasets. ProvDetector shows the worst throughput since it requires calculating the regularity score for each event and finding the K longest paths. As listed in Table 2, the open world console generated an average of 40 events per second. In industrial environments, centrally based detection systems are expected to handle hundreds to thousands of hosts in a cluster. Assume there are 500 hosts and the system must handle 20,000 events per second. Therefore, the throughput of UNICORN and ProvDetector does not meet industrial requirements. Overall, NODLINK has throughput that is comparable to or higher than existing detection systems.
# Efficiency ablation experiment
NODLINK designed memory cache and ISG to improve efficiency. In this section, we conduct an ablation study on their respective effects on efficiency using the DARPA dataset. To evaluate the caching design, we disabled caching and stored all source data and cached graphs in the graph database Neo4j. To evaluate the ISG algorithm, this paper uses the traditional Steiner tree approximation algorithm Kou and Mehlhorn, with each time window as the baseline. The results are shown in Table 6. Taking the throughput of NODLINK as a benchmark, the ratio between them is calculated. Overall, the design of the memory cache and ISG search algorithm greatly improves detection efficiency.
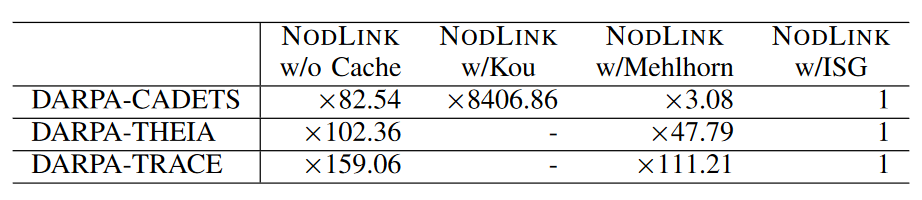
As shown in Table VI, when the memory cache design is disabled, the efficiency is 82.54 - 159.06 times slower than the original design. When replacing our algorithm with Kou, it is 8406.86 times slower on DARPACADETS. Due to the long processing time of the other two datasets, we were unable to obtain an accurate time for Kou. When replacing our algorithm with Mehlhorn, the efficiency is 3.08 - 111.21 times slower. The study found that the efficiency of these algorithms decreases with increasing data set size, which is a result of their high complexity.
# Other experiments
Experiment Cases: This article uses seven case studies to demonstrate how NODLINK detects real attacks in an open-world experiment. Overall, HOLMES fails to detect all these attacks because it lacks rules to detect webshell code injection. NODLINK and UNICORN can successfully detect them. NODLINK has higher node-level accuracy, which is always orders of magnitude greater than UNICORN.
Hyperparameter Experiments: This article uses the best experimental results on the DARPA dataset to select default hyperparameters. Overall, NODLINK is robust to parameter changes because we chose to use non-parametric learning techniques.
# Related work
SLEUTH is the first source-based online APT detection system. Various offline post-attack investigation systems exist, using a large number of graph learning algorithms. However, these may delay detection, resulting in financial losses. Compared to these systems, NODLINK is the first online system to achieve high detection accuracy without losing detection granularity. There are also studies on traditional intrusion detection systems, however, these systems are orthogonal to NODLINK as they cannot support APT attack investigation. In the future, ideas from the latest advances in traditional intrusion detection systems can be borrowed to improve the accuracy of anomaly identification in terminal Identification.
NODLINK is also related to traditional host-based intrusion detection techniques (HIDS). Log2vec embeds logs into vectors via graph embedding of random walks on heterogeneous graphs. Deeplog uses long short-term memory (LSTM) to model the sequential and contextual features of logs. These techniques are less effective at detecting APT attacks because they cannot link attack steps and reconstruct APT attack activity.
# Summarize
Attacking Attacks: NODLINK maintains secure parity with other score propagation-based techniques such as MORSE [46], PrioTracker [68] and NoDoze [41], providing efficient and accurate anomaly score calculations for source subgraphs. Despite its robustness, two potential attacks against NODLINK were discovered.
- An attacker can take advantage of the attenuation factor used in score propagation and use benign decoy events to reduce the abnormal score of the attack path. However, this theoretical threat is less problematic in practice, as creating benign nodes often leads to new anomalies and creates detectable anomalous path shapes.
- An attacker can try to evade detection by extending the time interval between each attack step, causing abnormal nodes to be purged from the cache. NODLINK counters this problem with a node retrieval mechanism that recovers evicted nodes from disk, preventing long-term attack evasion.
Robustness: Thanks to Grubbs’ test identification and VAE’s robustness, NODLINK is resilient to training data sets containing minor attacks. We evaluate the robustness of NODLINK against contaminated training data using five closed-world datasets, to which we add one day of attack data. The results show that NODLINK’s graph and node-level accuracy is not affected by the presence of some attack-related data in the training set. This is due to the design choice of this article to use VAE and non-parametric anomaly detection technology.
Detection systems based on online sources are better suited for timely detection of APT attacks than post-event detection systems. However, due to limited resources and timeliness, existing systems sacrifice detection granularity for accuracy. We observe that existing systems fail to achieve fine-grained detection because they waste most of their limited resources on apparently benign events. To this end, we propose NODLINK, a source-based online detection system that can achieve fine-grained detection while meeting the constraints of limited resources and timeliness. The key idea of NODLINK is to model the APT attack detection problem as STP, which has an efficient online approximation algorithm with limited theoretical error. Our experiments in a production environment show that NODLINK can achieve higher detection and investigation accuracy at the same or higher throughput compared to two SOTA online source analysis systems.