# author
•Wang Zhiliang is an associate professor and doctoral supervisor at the Institute of Network Science and Cyberspace, Tsinghua University. The main research directions include network testing and measurement and situational awareness, Internet architecture and protocols, etc.
•Traffic engineering masterpiece: Boosting Bandwidth Availability Over Inter-DC WAN
•Tsinghua University Network Management and Measurement Laboratory: Laboratory leader Professor Yang Jiahai, deputy director of Tsinghua University Information Technology Center, laboratory research includes: innovative basic research on Internet management architecture; research on network holographic measurement and network behavior; research on cyberspace mapping for the IPv6 next-generation Internet; research on network security analysis based on measurement (and research on cyberspace security situation awareness); research on cloud data center resource management and scheduling for network function virtualization.
https://github.com/threaTrace-detector/threaTrace/
# Introduction
We introduce THREATRACE, an anomaly-based detector that effectively detects covert and persistent host-based threats at the node level. THREATRACE takes the data provenance graph as source input and customizes an inductive graph neural network framework (GraphSAGE) [11] to learn the rich contextual information in the data provenance graph. GraphSAGE is a graph neural network (GNN). GNN is a set of neural network models designed for various graph-related works and has achieved success in many fields such as computer vision [12], natural language processing [13], chemistry and biology [14], etc. We leverage its ability to learn structural information about a node’s role in the provenance graph [11] for node-level threat detection. Note that THREATRACE aggregates node neighborhood information on the provenance graph, similar to the node embedding method. The main difference is that, at its core, THREATRACE is a deep learning method designed to solve the end-to-end abnormal node detection task, while the node embedding method aims to extract low-dimensional vector representations of nodes [15].
Threat detection using GraphSAGE is challenging: 1) How to train a model without prior knowledge of zero-day attack patterns? 2) How to solve the data imbalance problem?
We customized a novel framework based on GraphSAGE to address these challenges. Unlike previous graph-level detection methods, THREATRACE can learn the role of each benign node in the data source graph, thereby capturing covert anomalous behaviors without prior knowledge of attack patterns. THREATRACE is a semi-supervised anomaly detection method that requires the training data to be benign. We design a multi-model framework to learn different types of benign nodes, thereby solving the problem of data imbalance and effectively improving detection performance. THREATRACE is a real-time system that can be deployed in long-running systems with acceptable computational and memory overhead. It detects host intrusions in the early stages and tracks the location of anomalous behavior. We evaluate THREATRACE on five public datasets. The results show that THREATRACE can effectively detect host-based threats, which account for a small proportion of the overall system provenance graph, with fast processing speed and acceptable resource overhead.
Our paper makes the following contributions:
Novel node-level threat detection. To the best of our knowledge, THREATRACE is the first research effort to formalize the host-based threat detection problem as an abnormal node detection and tracking problem in a provenance graph. We propose a novel multi-model framework based on GraphSAGE for detecting node-level stealth threats.
High detection performance and new features. We evaluate the detection performance of THREATRACE on five public datasets and compare it with three advanced host-based threat detection methods. In these datasets, THREATRACE outperforms them. We further evaluated THREATRACE’s threat hunting capabilities in hosts. The results show that THREATRACE is able to successfully detect and track anomalous elements.
# Related work
# Threat detection based on traceability graph
- Misuse detection: matches known attack patterns (such as Poirot, Holmes), and has poor detection effect on APT/unknown attacks.
- Anomaly detection: Measuring the degree of deviation from normal behavior (such as StreamSpot, Unicorn, IPG, SHADEWATCHER), insensitive to small-scale attacks
# Exception tracking
After deploying an intrusion detection system on monitored hosts, it is important to track anomalous behavior and not just raise alerts. THREATRACE utilizes a node classification framework to trace anomalies directly after detecting them. Advanced anomaly-based detectors [6], [7] raise alerts when anomalies are detected in a system’s provenance graph. However, they cannot track the location of anomalies. Detectors capable of tracking anomaly locations are often misuse-based, such as Holmes [3] and Poirot [2]. They require prior knowledge of exception graph patterns. Nodoze [10] is another method for identifying anomalous paths in source graphs. Unlike the above detectors, Nodoze is a secondary diversion tool that requires alerts from other detectors as input. Current alerts from anomaly-based threat detectors are not suitable for Nodoze because they are graph-level and have no detailed information. RapSheet [9] is another secondary triage system that uses alerts from other TTP-based EDRs (Endpoint Detection and Response) as input and filters false positives in a constructed TPG (Tactical Provenance Graph). RapSheet faces the same problem as these misuse-based detection methods. SLEUTH [27] performs tag- and policy-based attack detection and tag-based root cause and impact analysis to build scenario graphs. PrioTracker [28] quantifies the rarity of each event to distinguish abnormal operations from normal system events. PrioTracker proposes a forward tracking technology for timely analysis of attack causality. MORSE [29] studied the dependency explosion problem in attacker step backtracking. The attack detection part of the MORSE framework is identical to the SLEUTH [27] system. The attack detection part of SLEUTH [27] and MORSE [29] is based on misuse. ATLAS [30] proposes a sequence-based learning method for detecting threats and constructing attack stories. Unlike misuse-based methods [2], [3], [27], [29], ATLAS uses attack training data to learn the co-occurrence of attack steps through time-ordered sequences. The methods introduced above all propose to track intrusions and build attack stories. THREATRACE can track anomalies without knowledge database or attack training data as input. However, it fails to build an attack story. We plan to study the gap between anomaly-based approaches and building attack stories in future work.
# Motivation and background
# GraphSAGE
Limitations of existing methods:
- Rules
- Covert attack
- Exception tracking
- Scalability
Essence of our approach: The core idea behind our approach is that even for covert intrusions that try to hide their behavior, nodes corresponding to malicious activity still behave differently from benign nodes. In Figure 2, the anomalous process node 1 /var/log/mail has thousands of connections to remote IP nodes, unlike the benign process node 2 /usr/bin/fluxbox. This phenomenon inspired us to formalize the host intrusion detection problem as an abnormal node detection problem. We customized a framework based on GraphSAGE to complete the node detection task. The detection results of the attack in Figure 2 will be presented as a case in §VI-C. This motivational example is also used to illustrate the design of our method.
# design

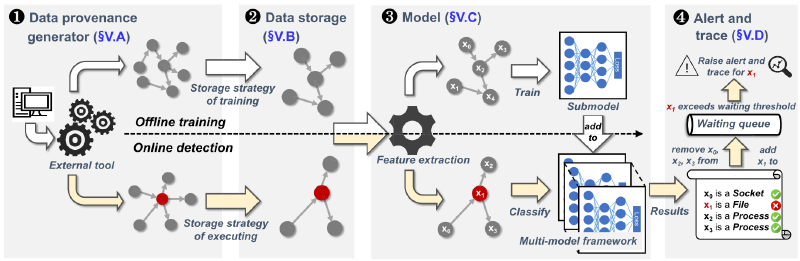
Data traceability generator. This component collects the host’s audit data in streaming mode and converts it into a provenance graph for subsequent analysis.
Data Storage. This component is responsible for allocating data to disk and memory. We store the entire graph on disk to store historical information and maintain a limited-sized subgraph in memory for training and detection. This storage strategy ensures THREATRACE’s scalability (P4) and dynamic detection capabilities.
Model . This is the core component of THREATRACE. We use the graph data created and assigned by the first two components as input and output exception nodes.
Achieving ideal outlier node detection is a challenge:
- THREATRACE is a semi-supervised anomaly detection method that does not require prior knowledge of attack behaviors during the training phase. Therefore, we cannot train the model using traditional binary classification modes.
- Host-based threat detection faces the challenge of data imbalance [16]. During execution, abnormal nodes may account for only a small proportion of the provenance graph. As a result, false positives are more likely to occur, interfering with judgment and leading to the “threat fatigue problem” [32].
- The difference between abnormal nodes and benign nodes may not be obvious enough, resulting in false negatives.
To address these challenges, we customize a multi-model framework based on GraphSAGE to learn different categories of benign nodes in the provenance graph of anomaly-free data (P1, C1). We then detect anomalous nodes based on the deviation of the predicted node type from its actual type. In this way, THREATRACE can detect abnormal nodes (P2) with a smaller proportion in the provenance graph under covert intrusion activities and directly locate them (P3). We propose a probability-based approach that reduces false positives and false positives (C2, C3).
Alerts and Tracking. We get the exception node from the previous component and decide in this component whether to alert and track the exception. We set waiting time thresholds and tolerance thresholds to reduce false positives and decide whether to issue an alert. Since THREATRACE detects threats at the node level, we directly track the location of anomalous behavior among the local neighbors of an anomalous node.
# Model
Feature extraction: Detecting anomalous nodes without learning attack patterns (C1) is challenging. Traditional anomaly detection tasks usually use benign and anomaly data to train binary classification models in supervised mode. However, since we assume no prior knowledge about attack patterns during the training phase, the model cannot be trained using binary labeled data. GraphSAGE has an unsupervised node classification mode, but it is not suitable for threat detection because it assumes that adjacent nodes have similar categories. In a provenance graph, adjacent nodes may have different categories (for example, two adjacent nodes may be a process and a file).
Since the unsupervised mode of GraphSAGE is not suitable for threat detection, we customized a feature extraction and label assignment method that enables THREATRACE to train the model in supervised mode without abnormal data and learn the local structural information of each benign node. We set the label of a node to the node type and extract its features as a distribution of the number of different edge types associated with it. The GraphSAGE model is trained in a supervised mode using annotated data to learn the different roles of benign nodes. The technical intuition behind feature extraction methods is that the behavior (or purpose) of a node is reflected in the edges associated with it. Take scanning processes, ransomware processes, and remote shell processes as examples (Figure 4). In Figure 4 (a), the behavior of the abnormal scanning process P1 is directly represented by a large number of connected edges of P1. For the ransomware process P2 in Figure 4(b), it first reads some files and generates encrypted copies. It then deletes (unlinks) the original file. For the remote shell process P3 (Figure 4 (c)), it receives instructions from IPa, executes Fp to escalate privileges, and sends Ft to another remote address IPb. Therefore, the model utilizes the extracted features to learn the hidden distribution of different nodes. If a node is misclassified during the execution phase, it means that its underlying distribution is different from the benign nodes learned during the training phase. That is, it may be an anomalous node with a different malicious mission than a benign node.

# Feature extraction
Type distribution of connected edges
# Training phase
During the training phase, we split the entire training graph into multiple subgraphs. Each subgraph consists of a certain number (set to 150,000 in this paper) of randomly selected active nodes, related nodes, and edges between them. The sets of active nodes in different subgraphs are not connected. Then, model training is performed on each subgraph G sequentially. We only need to store a limited-sized subgraph in memory instead of using the entire graph for training, thus ensuring the scalability of the model.
In covert intrusion activities, the proportion of abnormal nodes in the provenance graph may be very small. Therefore, false positives that interfere with judgment are more likely to occur (C2). According to the characteristics of the intrusion detection scenario, we customized a multi-model framework to reduce false positives. The characteristics of the host-based intrusion detection task provide the intuitiveness of the multi-model framework.
In an intrusion detection scenario
- Unbalanced number of node types (for example, when the host does not have frequent network connections, there may be thousands of process nodes and few remote IP nodes). Mining the underlying representation with a single model can be very difficult due to the imbalance of node types.
- Nodes of the same type may have different tasks (such as fluxbox process 2 and bash process 3 in Figure 2), and it is difficult to classify these nodes into one category using only a single model.
We keep a list X that stores the nodes that were not correctly classified. Its initialization includes all active nodes in the training subgraph. After training a sub-model (lines 6-13), we verify the nodes of X in this model (lines 15-21) and remove correctly classified nodes from X.
# Alarm alert
We set a time threshold T and dynamically maintain Q instead of directly issuing an alert to the monitoring system. The reason is that THREATRACE uses a streaming method to detect abnormal nodes and detect threats at an early stage, while in the training phase, it uses the full graph to learn the role of nodes to learn rich contextual information.
Therefore, a benign node may be detected as anomaly before reaching its final stage. We first store the abnormal nodes in Q and set a waiting time threshold T for them to reach the final stage. If it does not transform into a benign node within T time, we remove it from Q and treat it as an abnormal node. In streaming mode, a node may be detected multiple times. Therefore, an abnormal node may be initially detected as a benign node and then be detected as an active node when it starts performing malicious activities. When the number of abnormal nodes exceeds the tolerable threshold T, THREATRACE will alert the system and track the abnormal conditions of the 2-hop ancestors and descendants of the abnormal nodes.
# Experimental evaluation
Q1. Threat detection performance compared to state-of-the-art detectors. (Section VI-A, VI-B, VI-C)
Q2. Influence of parameters. (Section VI-D)
Q3. Ability to track abnormal behavior. (Section VI-C)
Q4. The ability to detect abnormal behavior in the early stages of intrusion. (§VI-C)
Q5. Runtime and system resource overhead. (§VI-E)
Q6. Robustness against adaptive attacks. (§VI-F)
Q7. Impact of hop number K (§VI-G)
Below we describe the dataset, experimental setup, and implementation of the comparison work. We compare THREATRACE with three anomaly-based host threat detectors (Unicorn, ProvDetector, and StreamSpot) and four anomaly log detectors (Log2vec, DeepLog, LogRobust, and LogGAN). We used five public datasets: StreamSpot, Unicorn SC-1 and SC-2, and DARPA TC #3 and #5 datasets. An overview of the data set is provided in Table 2, Table 4 and Table 6. We calculate the number of edges based on the number of logs. The number of nodes is obtained by counting the number of unique entities in all logs. In the StreamSpot and Unicorn datasets, normal and abnormal graphs are originally separated. We were unable to segment the nodes because no ground truth for the nodes was provided. For the DARPA TC dataset, we annotate anomaly data based on the names of attack events in ground truth files. For StreamSpot, Unicorn and LogGAN, we directly use open source projects [34], [35], [36]. The results for StreamSpot and Unicorn are almost identical to the original paper. ProvDetector is not open source. Therefore, we reimplemented it based on the original paper. We cannot compare its performance with the original paper on ProvDetector because we do not have the paper’s private dataset to evaluate it on. For DeepLog and LogRobust, we used github projects implemented by other researchers [37], [38]. For Log2vec, we obtained the project from the author. We are unable to perform performance comparisons with the original papers [16], [21], [22], [23] on log-level detectors because their datasets cannot be converted to provenance formats. We did not compare THREATRACE with other state-of-the-art misuse-based detectors because they require a priori expert knowledge to build the model [2], [3], [9], [30].
It should be noted that THREATRACE is a node-level detector, while the comparison method detects anomalies at different granularities (such as graph level, path level, and log level). We could not find other state-of-the-art anomaly-based methods that detect anomalies in the provenance graph at the node level. Although the detection granularity of the comparison method is different from that of THREATRACE, the detection goals of these methods are similar. Therefore, we select them as comparison methods and try our best to fairly compare their performance. The comparison principle is introduced as follows.
For graph-level experiments (§VI-A, VI-B), THREATRACE alerts the graph when the number of abnormal nodes exceeds the tolerance threshold ˆ T . StreamSpot and Unicorn can directly emit graph alerts because they are graph-level detectors. As a path-level detector, provDetector raises an alert when an anomalous path in the graph exceeds k p . We enumerate the parameters k p and set k p to 2 to make ProvDetector achieve better results. We did not compare with log-level detectors because the dataset for graph-level experiments does not have log data.
For node-level experiments (§VI-C), we did not compare with StreamSpot, Unicorn, and provDetector because their detection granularity is coarser than THREATRACE. THREATRACE alerts when a node anomaly is detected, while the log-level detector alerts when a log anomaly related to that node is detected. In graph-level and node-level experiments, we calculate precision, recall, accuracy, F-score, and false positive rate (FPR) based on the comparison of detection results with ground truth. In detection and runtime experiments, we tune the hyperparameters of the compared methods and select the best results.
We show that THREATRACE achieves better detection performance in these datasets (Q1). In §VI-D, we evaluate how specially designed parameters affect threat detection performance (Q2). In §VI-C, we further evaluate THREATRACE’s ability to track anomalies (Q3) and detect persistent intrusions early (Q4) using the DARPA TC dataset. We evaluate the operational performance of THREATRACE in terms of execution speed and system resource overhead (Q5) in §VI-E. We evaluate the robustness against adaptive attacks (Problem 6) in §VI-F. In §VI-G, we evaluate the impact of hop number K on detection and runtime performance (Question 7).
Table 1 lists the parameters of THREATRACE in Sections VI-A, VI-B, VI-C, and VI-F. We set these parameters based on the detection and running performance in each subsection of the experiment. Each submodel has the same GraphSAGE hyperparameters. Specifically, we set most of the parameters to their default values. We set the number of neurons in the hidden layer to 32, which is approximately half the number of features in the Unicorn SC-2 dataset. The submodel has only one hidden layer because each node aggregates information from its 2-hop neighbors. We will test the impact of the parameters in Section VI-D.
# streamspot Datasets
- Data set: The StreamSpot data set (Table 2) is a public data set built by StreamSpot [39]. It contains 6*100 information flow graphs from five benign scenarios and one attack scenario. Each scenario was run 100 times using the Linux SystemTap logging system [40], generating 100 images. Benign scenarios involved different benign activities: checking Gmail, browsing CNN.com, downloading files, watching YouTube, and playing video games. The attack scenario involves a drive-by download attack. The victim host accesses a malicious URL that exploits a Flash vulnerability to gain root access to the victim host. We use the same validation strategy as Unicorn, randomly splitting the dataset into a training set containing 75*5 benign graphs and a test set containing 25*5 benign graphs and 25 attack graphs. We do not compare with ProvDetector because edges in the StreamSpot dataset do not have a timestamp attribute, which is required by ProvDetector. We repeat this process and report the average evaluation results.
(1) Why do both THREATRACE and Unicorn achieve good performance on this data set? Compared with other datasets, the performance of the StreamSpot dataset is relatively weak, which is mainly reflected in two aspects. First, the average number of nodes in the StreamSpot dataset is only 3.5% of the Unicorn SC dataset and 0.9% of the DARPA TC dataset. Therefore, anomalous patterns in the StreamSpot dataset are easier to spot due to fewer benign background nodes. Second, abnormal graphs are significantly different from benign graphs. The most obvious evidence is also the size of the graph. The average number of edges for benign graphs is 173,857, while the average number of edges for abnormal graphs is only 28,423. For comparison, the average number of edges for the benign and abnormal graphs of the Unicorn SC dataset is 911,153 and 949,887 respectively, and there is no significant difference between the two.
(2) Why can’t Unicorn achieve 100% precision and recall? Our in-depth analysis of this dataset found that the 100 graphs of attack scenarios can generally be divided into two categories, namely 95 graphs and 5 graphs. Five figures in the second category are significantly different from the other 95 figures. They are more similar to Youtube scene graphs, which means the second set of threats are more subtle. Drive-by download attacks occur while the victim is browsing a website, similar to the Youtube scenario. It is difficult for kernel-based methods to detect these 5 images.

# Unicorn SC Datasets
The Unicorn SC dataset consists of two datasets: SC-1 and SC-2 [41]. They are Unicorn’s own dataset [41] and are more complex than the StreamSpot dataset. We use them to compare the detection performance of THREATRACE with Unicorn and ProvDetector. We cannot use StreamSpot for comparison because it cannot handle a large number of edges [7].
Dataset: The Unicorn SC dataset (Table IV) was generated following a typical cyber kill chain model in a controlled laboratory environment. Each graph is captured by CamFlow (v0.5.0) and contains full system provenance of one host running for three days. There is background benign activity in both benign and attack graphs. We use the same 5-fold cross-validation method as Unicorn: 4 sets of 25 graphs each are used for training, and a 5th set of benign graphs and 25 attack graphs are used for validation. We adopt a streaming model to replay verification graphs and detect them dynamically. We repeat this process and report the average evaluation results.
The results are shown in Table V. THREATRACE achieves higher performance than Unicorn using its own dataset. The reason for Unicorn’s poor performance is described in Unicorn’s paper [7]: the attacker has prior knowledge of the system and therefore acts more stealthily than the attacker on other datasets. We also found that THREATRACE alerts on fewer than 10 nodes in most attack graphs, demonstrating the stealthiness of this dataset. The comparison results on this dataset further demonstrate our motivation that it is difficult for graph kernel-based methods to detect covert threats. Additionally, THREATRACE also has a lower false positive rate compared to Unicorn and ProvDetector, which is important in mitigating the “threat fatigue problem.” ProvDetector performs poorly in this dataset. This may be related to the detection granularity. ProvDetector is a path-level detector capable of capturing anomalous paths in the source graph.

# DARPA TC Datasets
We use the DARPA TC dataset to evaluate THREATRACE’s ability to detect and track long-running intrusions. The datasets in the last two subsections do not have ground truth for the nodes, so we cannot use them to evaluate THREATRACE’s anomaly tracking capabilities.
Dataset: The DARPA TC dataset (Table VI) was generated during the Red Team vs. Blue Team competition of the DARPA Transparent Computing Project. The datasets from the third and fifth competitions have been made public [31]. Therefore, we use the DARPA TC #3 and #5 datasets for evaluation in this section.
Non-threatening files are used for training the model, and threatening files are used for evaluation. When a node is detected as an anomaly, we check the node’s 2-hop ancestors and descendants to track its location (§V-D), so we define metrics as follows:
- True positive. An anomalous node that is detected as an anomaly, or one of its 2-hop ancestors and descendants is an anomalous node that is detected as an anomaly. These nodes are defined as “true positives” because we can find them during alert tracking.
- False positive. A benign node that is detected as an anomaly has no abnormal nodes in its 2-hop ancestors and descendants. These nodes are defined as false positives because we were unable to find any abnormal nodes when performing alert tracing on them.
- True negative. Other benign nodules
- False negatives. Other abnormal nodes.
We drill down into the dataset to find reasons for the suboptimal detection results of log-level detectors. We found that anomalous entity logs in the DARPA TC dataset are not significantly different from benign logs. For example, the associated log for micro apt in Figure 5 is “Remote shell dropped file named micro apt to host”, which is a benign file download log in the host. The anomalous behavior of micro apt is hidden in the neighbor information in the graph.

DeepLog, LogRobust, and LogGAN are unable to detect anomalies in graphs. Therefore, they hardly capture the anomaly context information in the graph. Log2vec uses node embedding and clustering methods to detect anomalous logs in graphs. It aggregates information from a node’s neighbors and thus achieves better results than other log-level detectors. Log2vec classifies tiny logs into benign groups. One possible explanation is that the nodes of Log2vec are logs rather than system entities. Therefore, the information of the entity is scattered in the graph, because the log of the entity is displayed as multiple nodes in the graph of Log2vec, resulting in insufficient information aggregation. This is why recent research suggests provenance maps are a better data source

# robustness
(1) The attacker has training data. The attacker has the training data. Using training data to avoid attacks can be performed in two steps. The first step is to find a benign node xb in the training data that is most similar to the abnormal node x and has the same category as x.
(2) An attacker with a THREATRACE model. The attacker knows the THREATRACE model, including the trained parameters and hyperparameters. Therefore, the attacker can directly solve the optimization problem based on the model’s loss.